
Fig. 5.
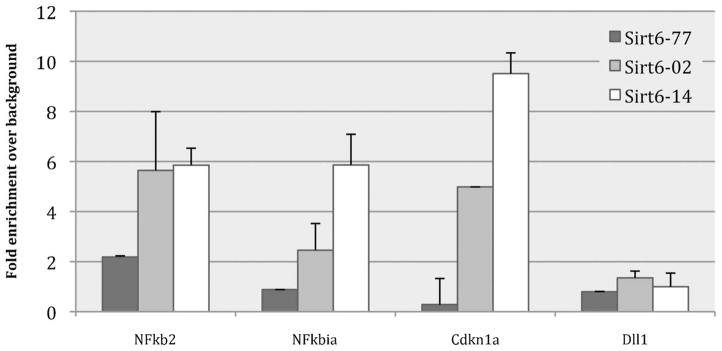
Bar graph of HTChIP results comparing ChIP enrichment obtained using three different batches of an anti-SIRT6 antibodies generated from the same antibody clone. Dll1 is included as a negative control promoter; Cdkn1a is a positive control promoter. From this graph, lot #14 is the SIRT6 antibody lot with highest sensitivity and specificity. ChIP enrichment is shown here as fold enrichment over background control to highlight the difference in specificity between antibody lots. Error bars represent standard error over three (3) technical replicates.