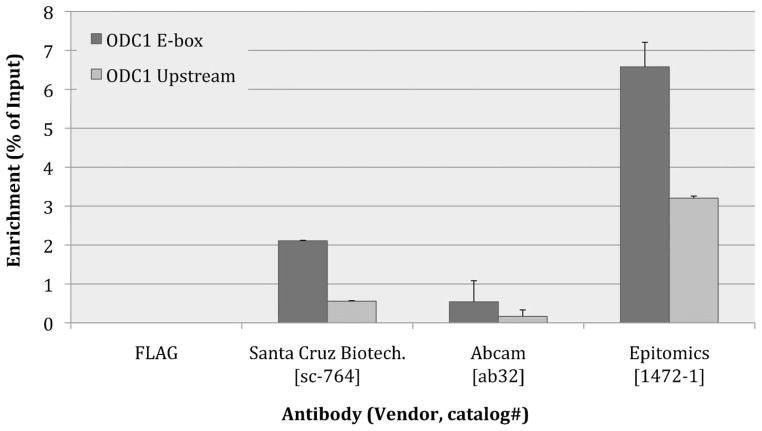
Fig. 6.
Bar graph of HTChIP results comparing ChIP enrichment obtained using three different anti-MYC antibodies from different vendors. Odc1 Upstream is the negative control region; Odc1 E-box is the positive control Odc1 promoter. From this graph, sc-764 has the best signal to noise, but Epitomics 1472-1 has higher sensitivity and higher signal. Note that anti-FLAG was used as the non-specific background control. Since enrichment for FLAG is zero (no PCR C(t) value), it is mathematically not possible to calculate the fold enrichment over background. Therefore here ChIP enrichment is shown as a ratio over Input without any normalization. Error bars represent standard error over three (3) technical replicates.

