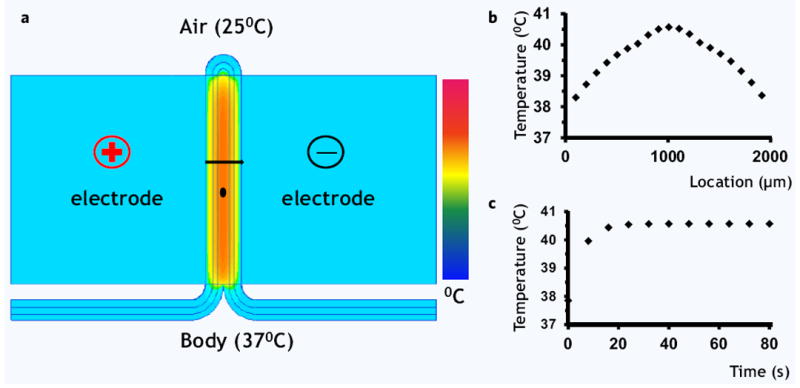
Figure 2.

Thermal effects of pulsed electric field on the skin, numerical model. (a) Color map of temperature distribution after 80 seconds of continuous treatment with PEF at 1000 Volts. Most of the temperature increase was observed in the deeper layers of the wound. The black line shows the contour, through which spatial temperature distribution was modeled (b). The black dot shows the location where the time-dependent temperature increase was modeled (b).
