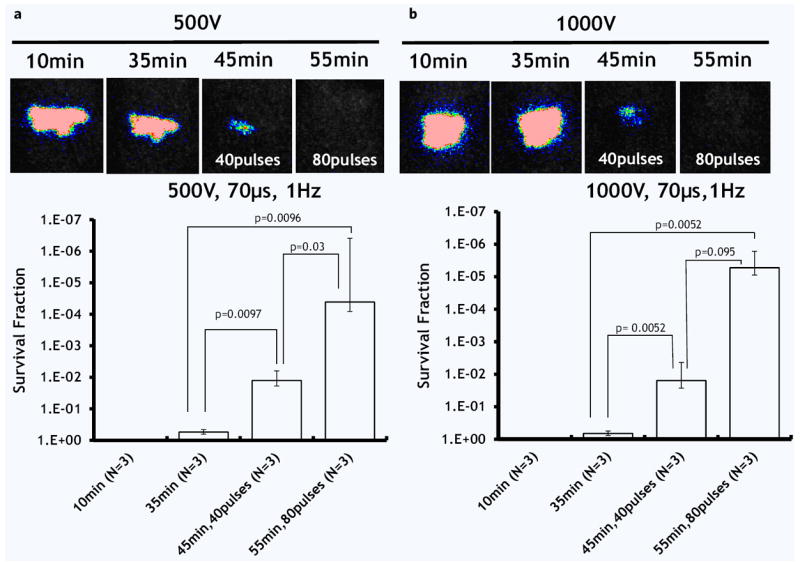
Figure 4.

The effect of pulse number and electric field strength on A. baumannii infection load reduction. (a) Applied voltage 500 V. (b) Applied voltage 1000 V. Top panel shows the post-burn time when the images were taken. The bottom panel shows the survival fraction of microorganisms as detected by the top panel images (logarithmic, inversed scale). N shows the number of animals per group. Error bar ± standard deviation of the mean.
