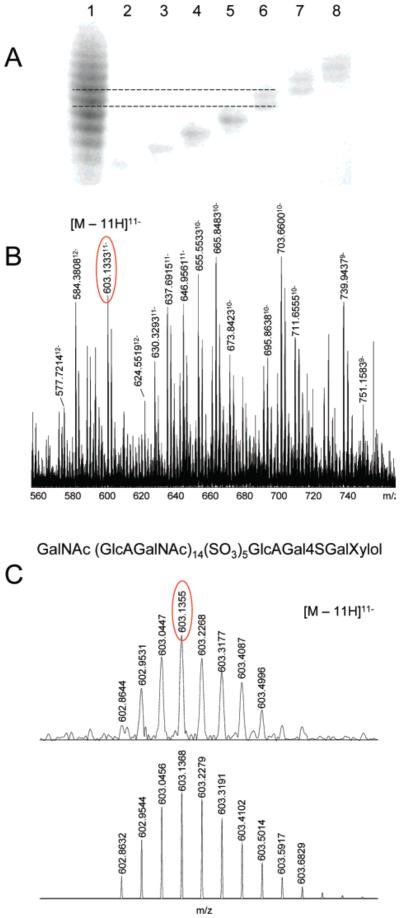
Figure 6.
(A) PAGE analysis of bikunin CS. Direction of migration is from top to bottom. Lane 1, bikunin CS mixture; lanes 2–8, fractions of the mixture isolated by preparative PAGE followed by electroblotting. (B) FTICR-MS analysis of the fraction in lane 6: portion of the spectrum showing peaks corresponding to several components with multiple charge states. (C) Experimental and simulated FTICR mass spectra of the 603.13 m/z peak, corresponding to [M – 11H]11− ion of a hexasulfated, 33-monosaccharide CS chain.

