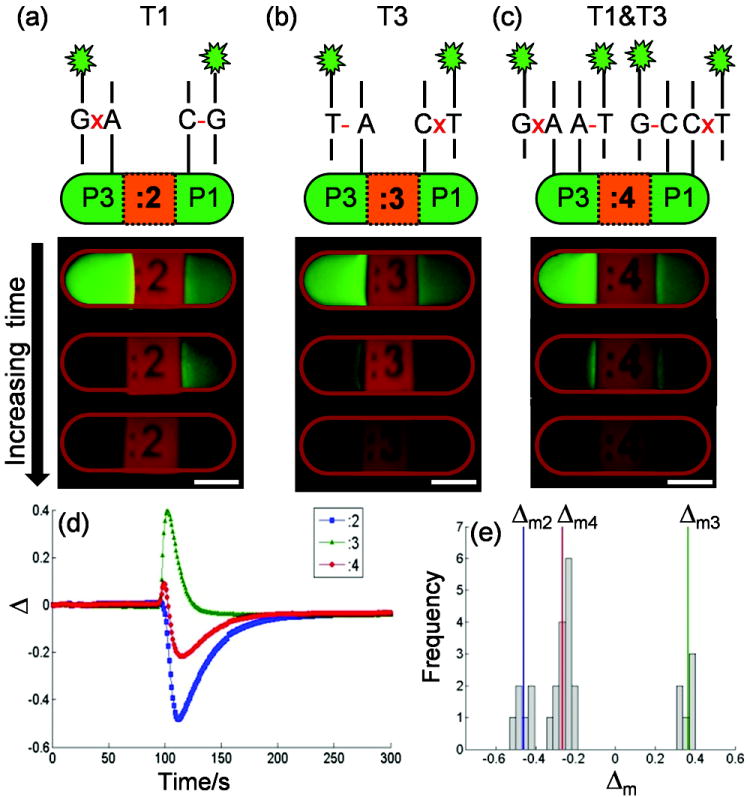
Figure 2.

Three batches of particles containing allele-specific probes P1 and P3 (5’-CCTGGGAAAGT(C/A)CCCTCAACA-3’, alternatives shown in parentheses) form perfectly matched (PM) or mismatched (MM) duplexes on either end of a particle when they hybridize, respectively, with synthetic DNA targets T1 (a), T3 (b), and a 50/50 mixture of T1 and T3 (c), simulating three possible genotypes. A time-dependent difference in fluorescence retention ratio, Δ, across each particle is generated when subjected to an alkaline condition (pH 11.20 phosphate buffer). Δ curves for each hybridization scheme are shown in (d) and the peak values Δm are found for a mix of particles and plotted in a histogram (e). Δm fall into natural groups for each hybridization scheme. Scale bars are 100 μm.
