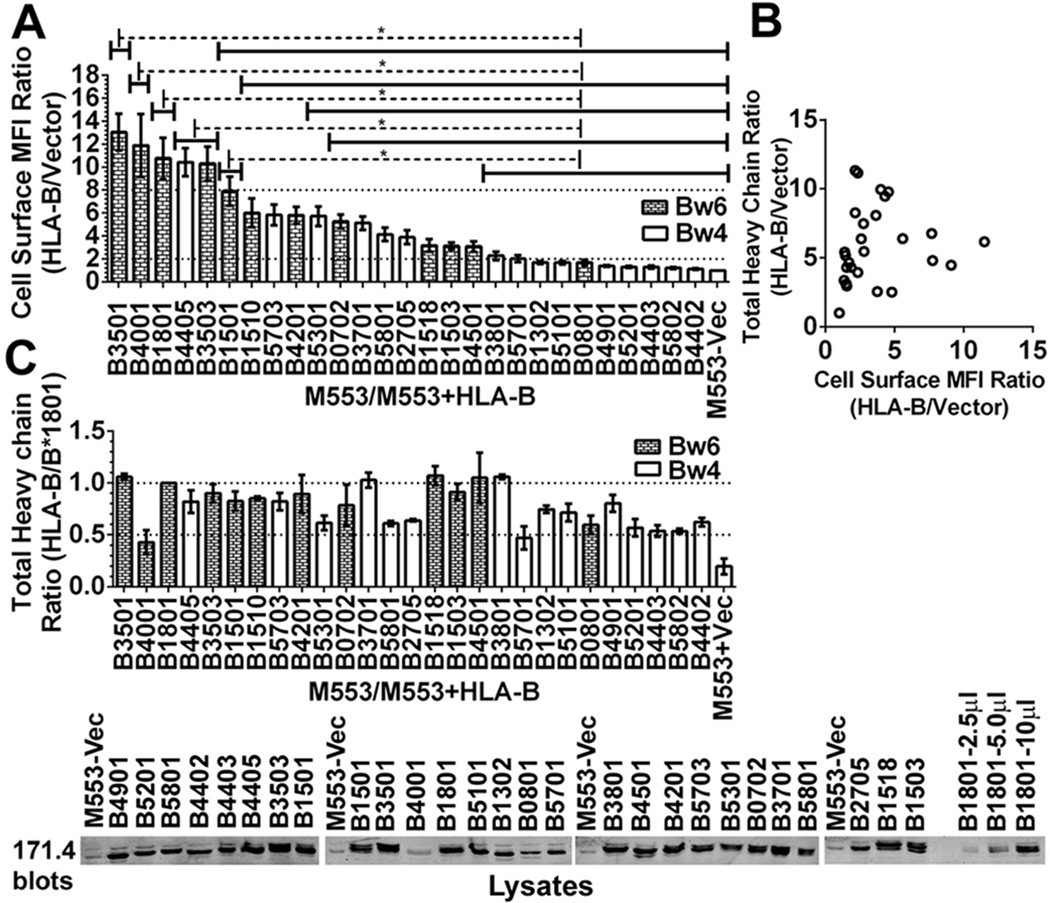
Figure 1. Variable expression of HLA-B molecules in tapasin-deficient cells.
A) The y-axes show cell surface expression ratios (mean fluorescence intensity (MFI ratios)) of MHC class I staining in M553 cells (a tapasin-deficient melanoma cell line) infected with retroviral constructs encoding the indicated HLA-B allotypes relative to M553 cells that were infected with a virus lacking MHC class I (vector). MHC class I surface expression was analyzed by flow cytometry using the W6/32 antibody. Statistical analyses were done using a one-way ANOVA test, followed by a Tukey’s multiple comparisons procedure for all pairwise differences of means. Significant differences are indicated (with an asterisk) on the graph (P< 0. 05). Data represents averaged MFI ratios derived from 10–15 independent flow cytometric analyses from five independent infections (infections 1–5) of M553 cells. B) In infection 5, a Pearson analysis was used to examine correlation between cell surface MFI ratios assessed by flow cytometry and total cellular expression ratios assessed by immunoblotting of cell lysates. A significant correlation was not observed. C) Top panel: Cell lysates from infection 5 of M553 cells were tested by quantitative fluorescence-based immunoblotting with the heavy chain-specific 171. 4 antibody. The bar graphs show total cellular expression ratios (relative to cells expressing HLA-B*1801) of the indicated HLA-B molecules. Averaged values from three independent sets of immunoblotting analyses of infection 5 are shown. Lower panel: Representative quantitative immunoblots with the 171. 4 antibody of indicated cell lysates from infection 5. 10 µl of total cell lysate was loaded in each lane, unless otherwise indicated. The last three lanes show HLA-B*1801 heavy chain expression in M553-HLA-B*1801 lysates (incremental loads of 2. 5–10 µl).

