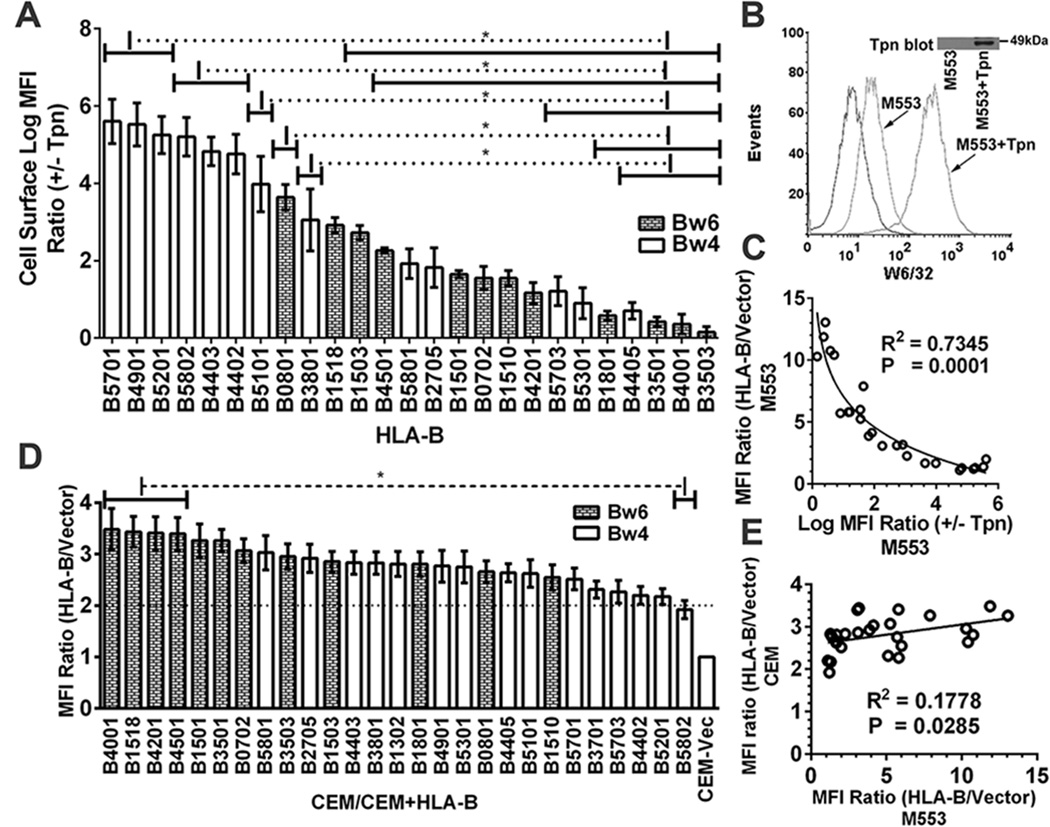
Figure 2. Reduced variability of HLA-B expression in tapasin-sufficient cells.
A) Cells from one of the infections described in Fig. 1A were subsequently infected with a tapasin-encoding virus. Following subtractions of the vector alone backgrounds the MFI ratios in the presence and absence of tapasin (+tapasin/−tapasin MFI ratios) were calculated for each HLA-B-expressing cell line. B) Representative histograms of M553 cell infections with a tapasin-encoding or control retrovirus. Flow cytometric analyses with the W6/32 antibody of cell surface expression of the endogenous MHC class I of M553 cells that were infected with retroviruses encoding or lacking tapasin. C) A Pearson analysis was used to examine correlation between averaged cell surface MFI ratios (HLA-B/vector) in M553 (Fig. 1A) vs. Log MFI (+Tapasin/−Tapasin) ratios (Fig. 2A). D) CEM cells (a CD4 T cell line) were infected with retroviruses encoding indicated HLA-B allotypes or a control virus lacking HLA-B (Vector). MHC class I cell surface expression was analyzed by flow cytometry using the W6/32 antibody, and HLA-B/vector MFI ratios were determined. E) A Pearson analysis was used to examine correlation between averaged MFI ratios (HLA-B/vector) in M553 and CEM cells. Data represent averaged (A and D) MFI values derived from 2–4 (A) or 10–12 (D) independent flow cytometric analyses from one (A) or three (D) independent infections. Statistical analyses (A and D) were done using a one-way ANOVA test, followed by a Tukey’s multiple comparisons procedure for all pairwise differences of means. Pearson R square (R2) and significantly different values (P) are indicated on the graph. P< 0. 05 is considered significant.

