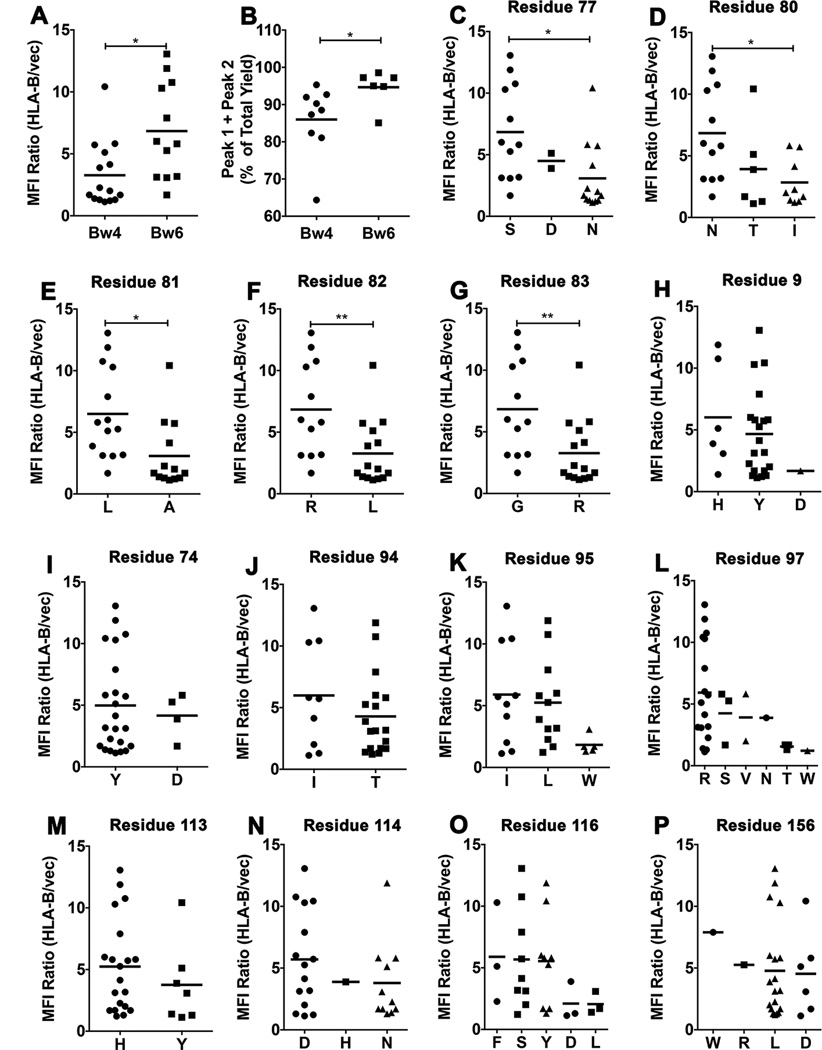
Figure 5. Residue contributions to tapasin-independent assembly.
A) Averaged MFI ratios derived in Fig. 1A were compared for HLA-Bw4 and HLA-Bw6 allotypes. Statistical analyses are based on an unpaired t-test. B) Peak 1+ Peak 2 yields, derived from the 4 ° C refolding data in Fig. 4A were compared for HLA-Bw4 and HLA-Bw6 allotypes. Statistical analyses are based on an unpaired t-test. More significant differences were observed for the 1 hour/room temperature refolding data. C–P) HLA-B allotypes were grouped based on the presence of dimorphic or polymorphic residues at the indicated heavy chain sequence positions. Averaged MFI ratios derived in Fig. 1A are compared for allotypes with a given amino acid residue at each of the indicated dimorphic or polymorphic sites. Statistical differences between groups were assessed based on unpaired t-tests for dimorphic residues. For polymorphic residues, a one-way ANOVA test was used, with a Tukey’s multiple comparisons procedure for all pairwise differences of means. Statistically significant differences are indicated by asterisks on the graphs (* indicates P< 0. 05; ** indicates P<0. 01).

