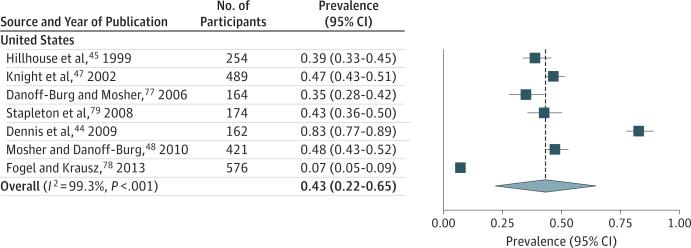
Figure 6. Forest Plots of Primary Analyses: Past-Year Exposure in University Students.
Past-year exposure in university students. Plots show point prevalence (squares), 95% CIs (horizontal lines), summary prevalence and 95% CIs for each region and overall (diamonds, the width of which represents the 95% CIs), and summary prevalence estimate (dotted line). Records are listed by date of publication and then by date of data collection. (See eTable 1 in the Supplement for full citations and descriptions.)

