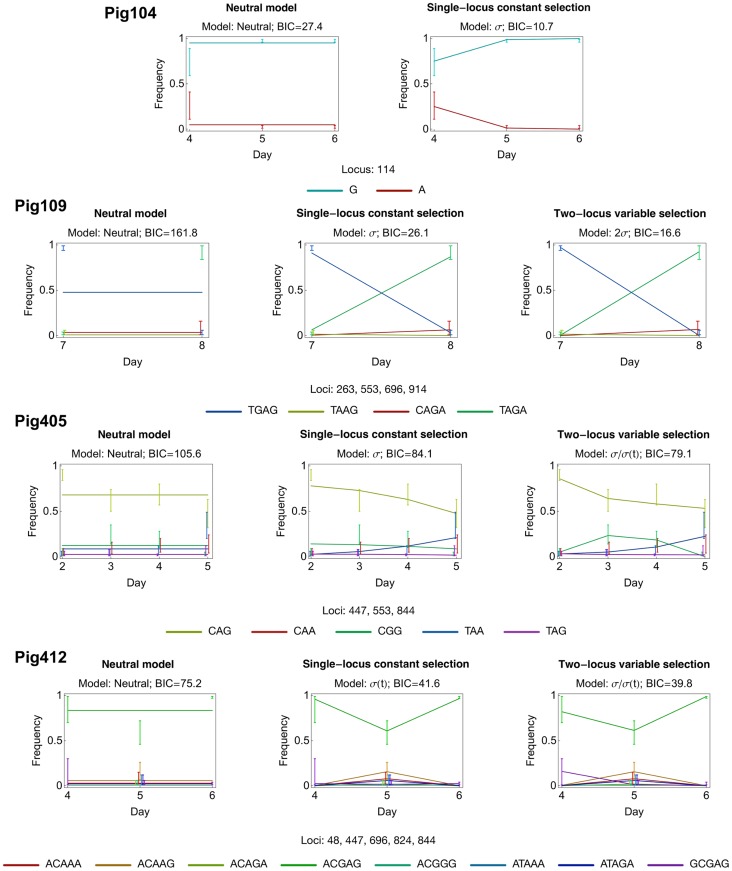
Figure 3. Representative haplotype frequency plots for different models of selection.
Comparative model fits for Pig104: A model of constant selection against the G→A mutation at locus 113 outperforms the neutral model, Pig109: A model in which two of three mutations at loci 553, 696, and 914 outperforms models in which one or none of these mutations is under selection. Pig405: A two-locus selection model of constant selection for the G→A mutation at locus 844, with variable, decreasing selection for the A→G mutation at locus 553 gave the best fit to the data. Pig412: A model of time-dependent selection at the locus 696, with constant negative selection at locus 48 was optimal. Coloured error bars show 95% confidence intervals for the marginal frequency of each haplotype given the observation; error bars are offset from their respective time-points to allow their identification. Inferences are shown only for haplotypes that were observed in the sequence data. In Pig405 the CAA haplotype frequency is obscured below the TAA frequency.

