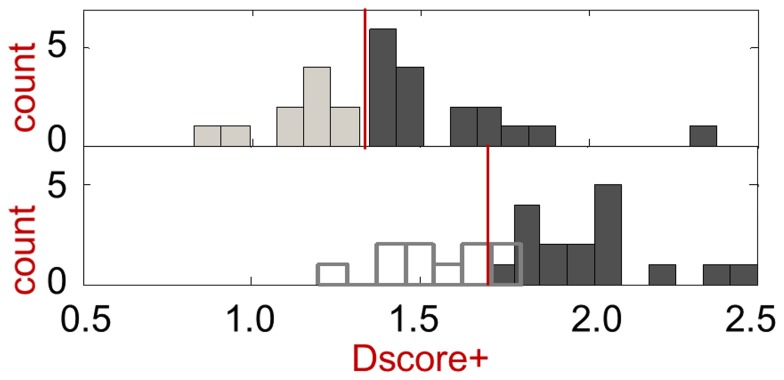
Figure 2. Druggability score histograms for validation set binding site structures.
The top panel depicts results with the original crystal structures used rigidly, with a red line indicating the Dscore+>1.3 cutoff used in this work. The top Dscore+ value is shown for each of the 27 protein targets (17 druggable and 10 difficult, where the prodrug targets are considered difficult). The bottom panel depicts results after modeling of protein flexibility, with difficult targets in ghost outline because flexibility modeling is not usually applied to sites that score below the Dscore+>1.3 cutoff. Difficult targets are indicated by the lighter bars, while druggable targets are indicated by the darker bars. See text for further discussion.

