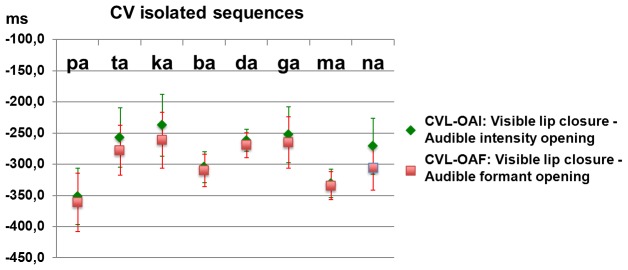
Figure 5. Delay between the first visual event (for the closing phase) and the first auditory event (for the opening phase) in isolated /Ca/.

Negative values mean that the acoustic event lags the visual one. In red: acoustic events for formants. In green: acoustic events for intensity. Signs point at mean values (over the 6 repetitions), and error bars correspond to the standard deviation.
