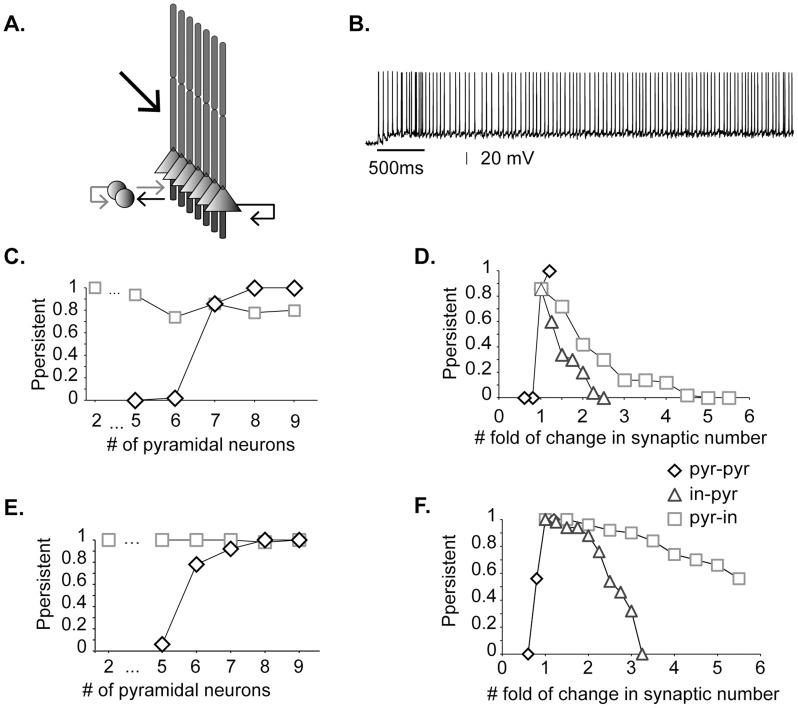
Figure 1. Synaptic drive underlies persistent activity induction.
A. The microcircuit model includes seven pyramidal cells and two inhibitory interneurons reciprocally connected. Black arrows: excitatory connections, grey arrows: inhibitory connections (adapted with permission from [9]). Persistent activity is induced following external stimulation of the proximal apical dendrites (thick black arrow). B. Indicative trace of persistent activity in the model (iNMDA-to-iAMPA ratio = 2.3 and dADP = 0 mV). Bar shows stimulus presentation. C. Probability of persistent activity induction as a function of the number of pyramidal neurons in the microcircuit. Diamonds correspond to increasing numbers of cells whereby each pyramidal-pyramidal neuron pair is connected with 5 synapses. Squares correspond to increasing numbers of cells in which the total number of excitatory connections per neuron is fixed to 31 (corresponding to a network with 7 pyramidal neurons). D. Probability of persistent activity emergence as a function of changes in the number of synapses between pyramidal neurons (pyr-pyr, diamonds) and between interneurons and pyramidal neurons (in-pyr, triangles/pyr-in, squares). E, F. Same as in C, D, when in vivo-like background synaptic activity was activated.

