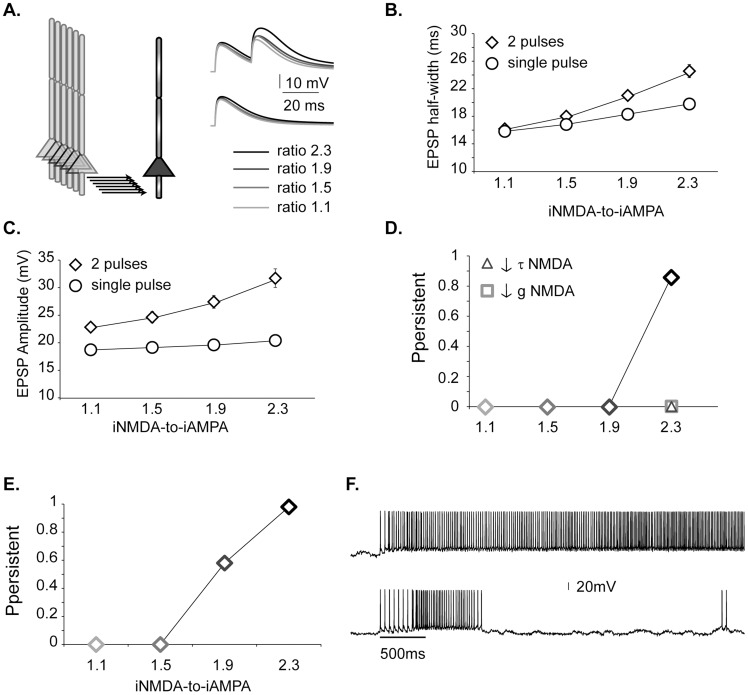
Figure 2. iNMDA-to-iAMPA ratio controls persistent activity induction.
A. Indicative basal EPSP traces from a single pyramidal neuron for different iNMDA-to-iAMPA ratios (1.1, 1.5, 1.9 and 2.3) after stimulation of 31 synapses with 2 pulses at 50 Hz (upper panel) or 1 pulse (lower panel), under conditions of Na+ channel blockade. B. Mean ± std of the dendritic EPSP half width. The EPSP half width increases non-linearly for ratios above 1.5, only for the paired pulse protocol. C. Mean ± std of the dendritic EPSP amplitude for the same conditions as in B. Note the increase in amplitude only for the paired pulse protocol. D. Probability of persistent activity emergence for different iNMDA-to-iAMPA ratios, calculated over 50 trials. Triangle: reduced NMDA decay time constant (from τ = 107 ms to τ = 18 ms). Square: blocked NMDA receptors (90% reduction in conductance, while compensating for reduced excitability by increasing the AMPA conductance). E. Probability of persistent activity emergence for different iNMDA-to-iAMPA ratios calculated over 50 trials, in the presence of background synaptic activity. F. Indicative voltage traces from a persistent trial (top) and a transient stimulus response (bottom) in the presence of background synaptic activity (iNMDA-to-iAMPA ratio = 1.9). Bar indicates stimulus presentation.

