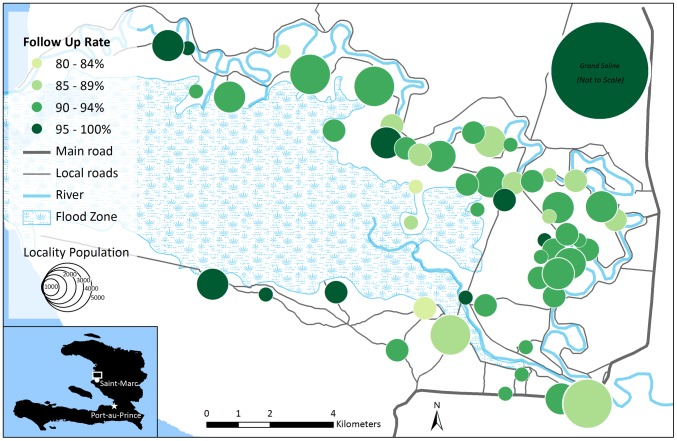
Figure 3. Map of vaccine follow-up rate of second doses in a reactive oral cholera vaccine campaign in rural Haiti, April–June 2012.
Grand Saline, located directly north of the mapped area, is visualized to compare coverage rates to the rest of the campaign area, but its location and size are not to scale. Sub-area vaccination post locations were not collected in Grand Saline and therefore are not mapped.

