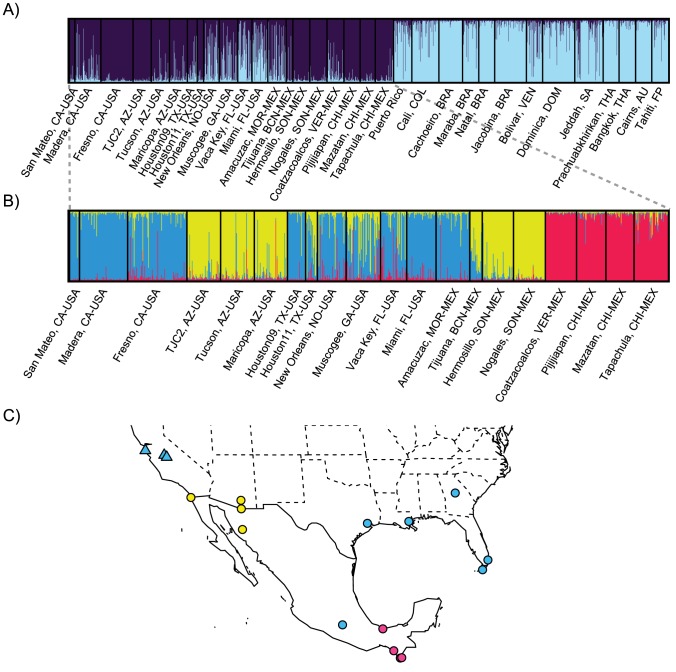
Figure 1. Genetic structure within pantropical populations of Aedes aegypti.
STRUCTURE bar plots indicating relatedness of Aedes aegypti populations based on 12 microsatellite loci. Each vertical bar represents an individual. The height of each bar represents the probability of assignment to each of K optimal clusters (different colors) determined using the Delta K method. (A) North America and Asian populations (K = 2), and (B) North American populations (K = 3). (C) Map indicating the North American geographic locations sampled in this study. (Δ) California, (○) other locations in North America.

