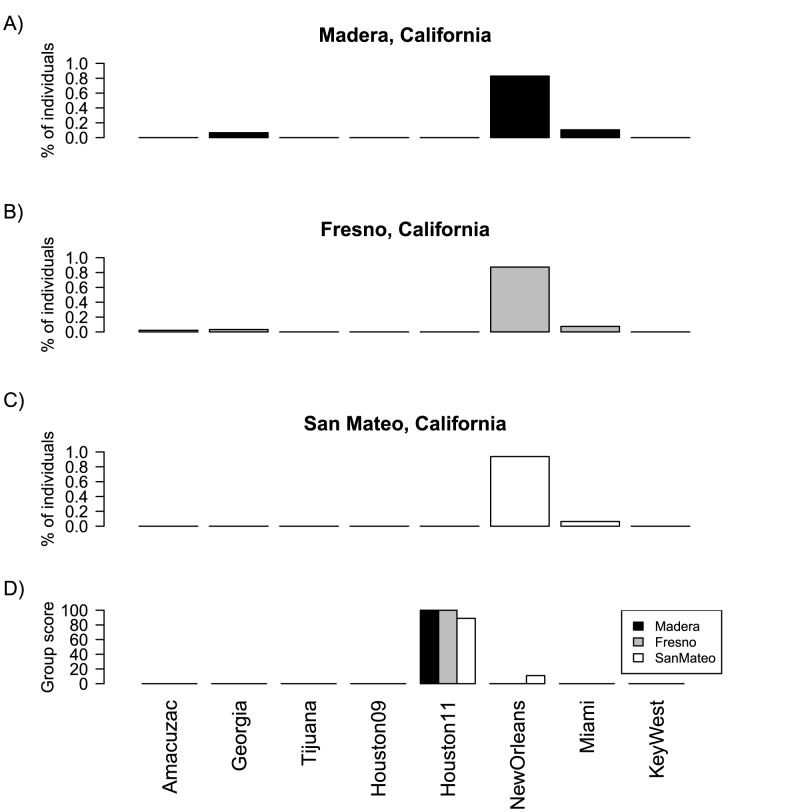
Figure 2. Individual and group mosquito genetic assignments.
Percentage of individuals from Madera (A), Fresno (B), and San Mateo (C) counties assigned with the highest probability to each of the reference populations. (D) Scores calculated for each of the reference populations after group assignment of each of three California populations. Assignments were performed using Bayesian criteria for likelihood estimation with GENECLASS 2.0.

