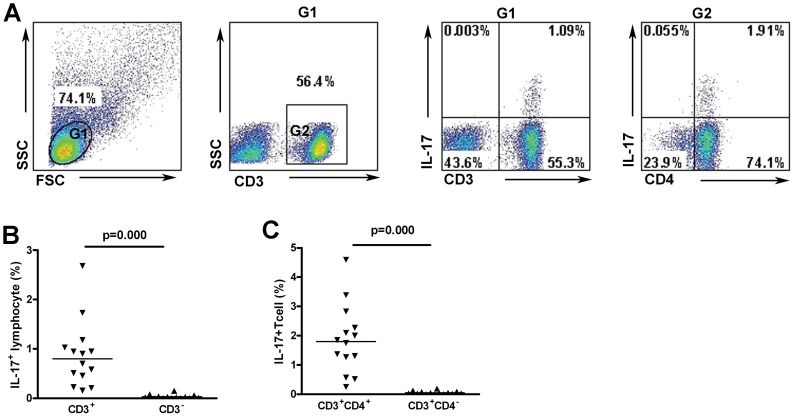
Figure 4. Th17 frequencies in CSF lymphocytes from neurosyphilis patients.
(A) Representative dot plot of CSF IL-17-producing cells in CD3+CD4+, CD3+CD4− and CD3− lymphocytes from neurosyphilis patients. (B) Frequencies of IL-17+ cells in the populations of CD3+, CD3− lymphocytes (n = 14). (C) Frequencies of IL-17+ cells in the populations of CD3+CD4+, CD3+CD4− lymphocytes (n = 14). Results represent the median + individual values.

