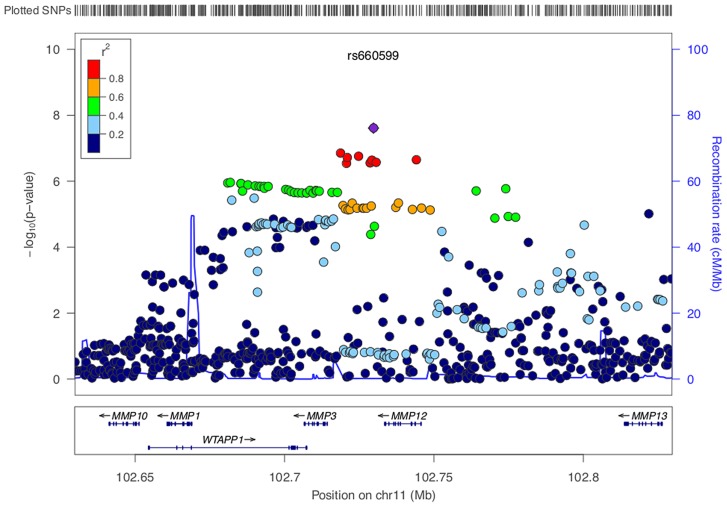
Figure 1. LocusZoom plot of MMP12 association using age-at-onset informed approach.
SNPs are colored based on their correlation (r2) with the labeled top SNP, which has the smallest P value in the region. The fine-scale recombination rates estimated from 1000 Genomes (EUR) data are marked in light blue, with genes marked below by horizontal blue lines. Arrows on the horizontal blue lines show the direction of transcription, and rectangles are exons. SNP p-values are from the discovery meta-analysis only with the exception of rs660599, for which the given p-value indicates the overall evidence for association from the discovery and replication cohorts.

