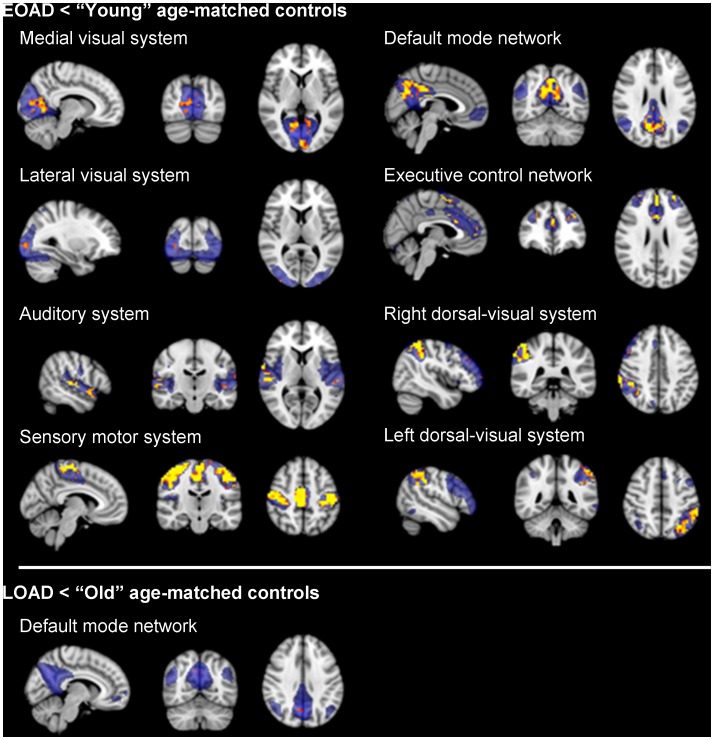
Figure 2. Lowered functional connectivity in AD patients when compared to age-matched controls.
Upper panel shows lower functional connectivity in early-onset AD patients when compared to ‘young’ age-matched controls. Lower panel shows decreased functional connectivity in late-onset AD patients (EOAD) when compared to ‘old’ age-matched controls. Standard maps of the Resting State Networks (RSNs) are shown in transparent blue. Upper panel: Lower functional connectivity was found in early-onset AD patients when compared to aged-matched young controls within the medial-visual system, lateral-visual system, auditory system, sensory-motor system, default mode network, the executive control network and bilateral dorsal-visual stream. Lower panel: late-onset AD patients (LOAD) show lower functional connectivity when compared to old age-matched controls within the default mode network only. Results are displayed in radiological orientation on standard MNI space (MNI152 2 mm), after correction for multiple comparisons across space (p<0.05). Gender and voxel-wise gray matter maps were used as covariates. Brighter colors represent most significant results. Abbreviations: R = right. L = left.

