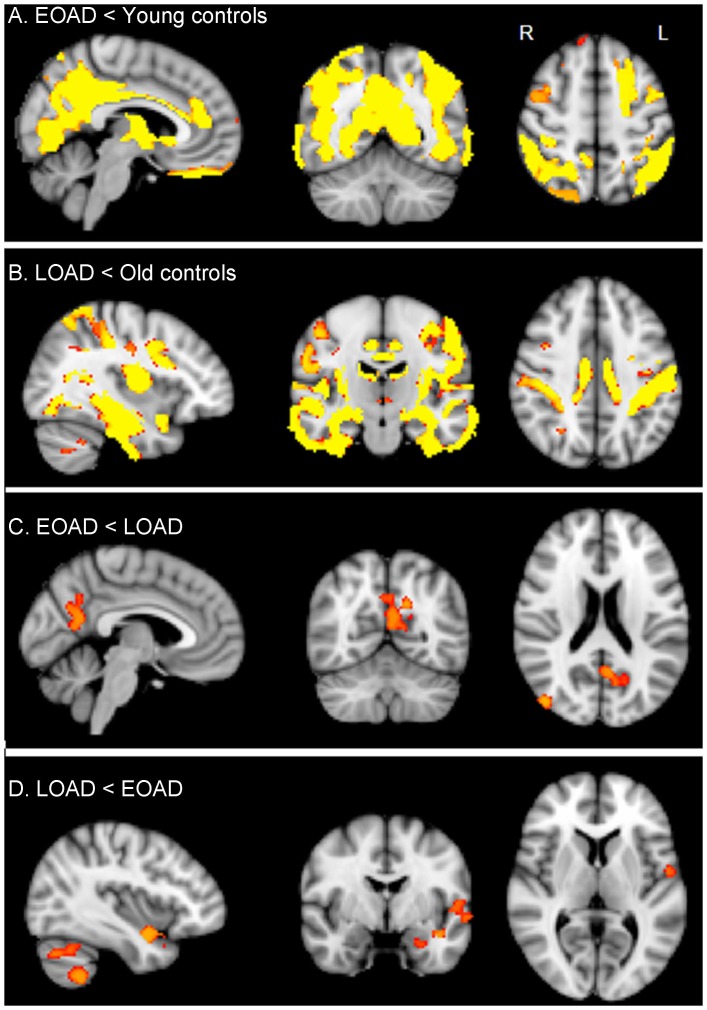
Figure 4. Gray matter loss.
Regions of decreased gray matter volume in early-onset AD (EOAD) patients when compared to age-matched young controls (A). Regions of decreased gray matter volume in late-onset AD (LOAD) patients when compared to age-matched old controls (B). Regions of decreased gray matter volume in early-onset AD patients when compared to late-onset AD (C). Regions of decreased gray matter volume in late-onset AD patients when compared to early-onset AD (D). Results are corrected for multiple comparisons (p<0.05) and are shown in radiological orientation on standard MNI space (MNI152 2 mm). Brighter colors represent most significant results. R = Right. L = Left.

