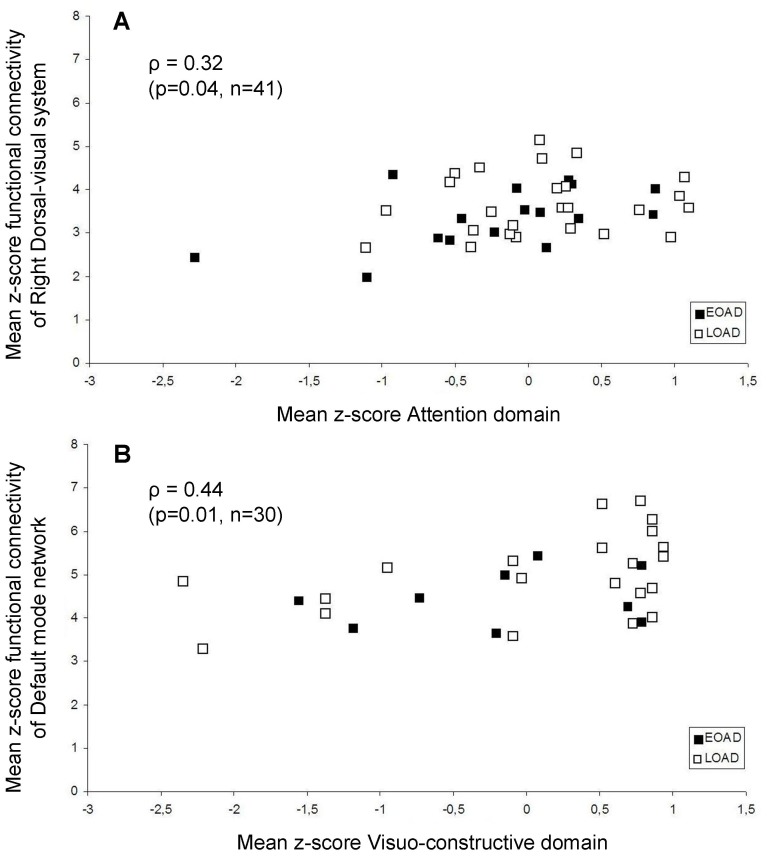
Figure 5. Significant correlations of functional connectivity with cognition in AD patients.
Scatterplots of significant Spearman correlations across AD patients are shown; mean z-scores representing functional connectivity within the resting state network (RSNs) are displayed on the y-axis. Mean z-scores composing the cognitive domains are displayed on the x-axis. Functional connectivity of the right dorsal visual stream (A) was associated with attention. Functional connectivity of the default mode network (B) was associated with visuo-construction. Black squares represent early-onset (EOAD), white squares represent late-onset AD patients (LOAD). Spearman correlation coefficients (ρ) are reported, with corresponding p-value and number of subjects included in the correlation analysis.

