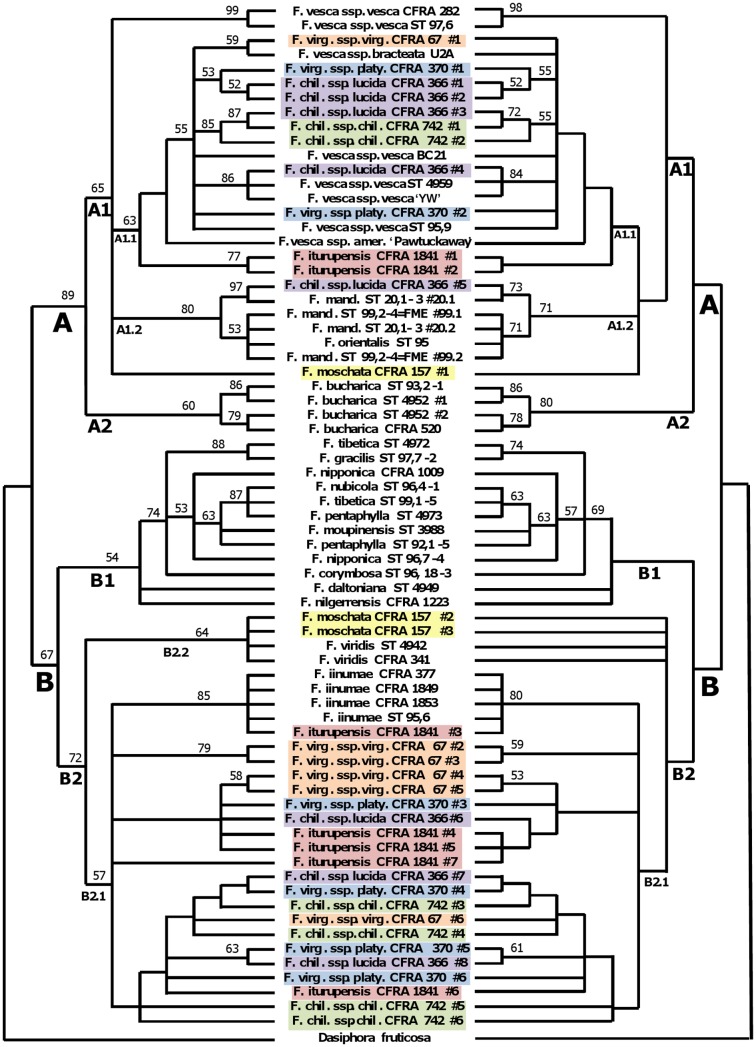
Figure 3. Comparison between most resolved MP and ML trees.
The phylogenetic tree on the left was produced using an MP analysis on the data set with binary coded gaps included and both coded gaps and transversions given a weighting of 1.5. The phylogenetic tree on the right was produced using ML and the TPM1uf+G evolutionary model as indicated by JModeltest (Posada, 2008; Guindon Gascuel 2003). Bootstrap support values above 50% are shown on both trees.

