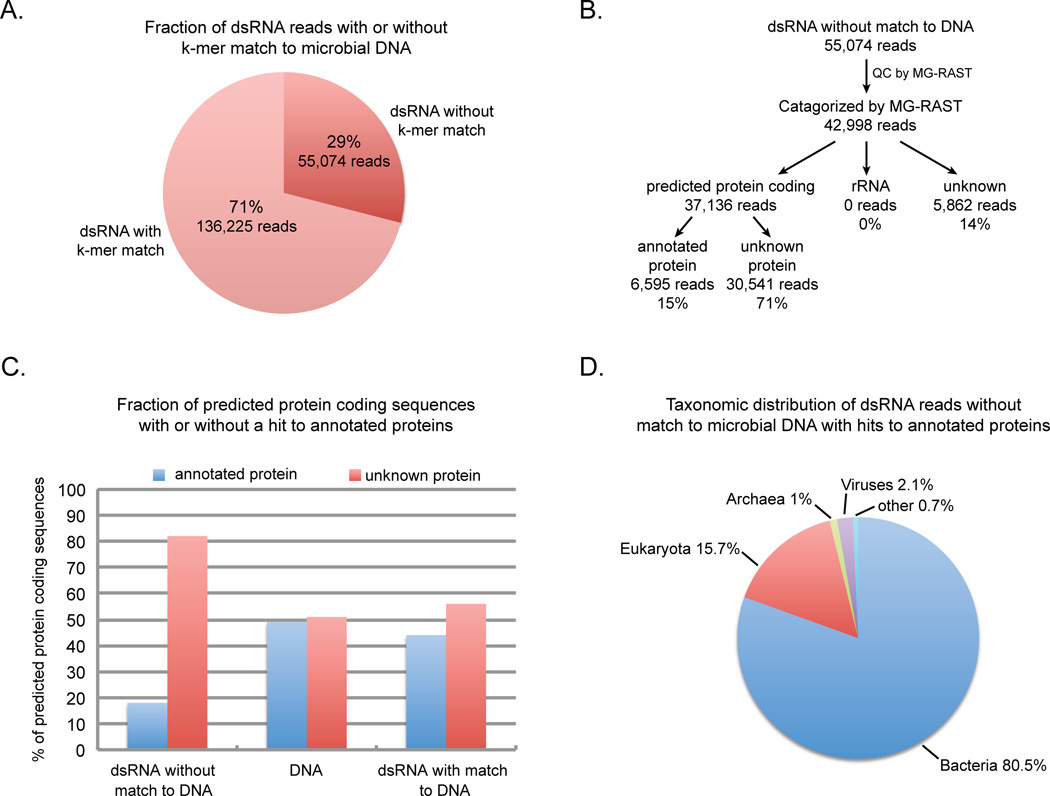
Figure 2. Analysis of microbial dsRNA sequences.
A. Results of shared k-mer analysis between dsRNA sequences and DNA sequences obtained from the same microbial sample. B. Flow diagram of the analysis of the dsRNA reads without a k-mer match to the microbial DNA. C. The percentage of reads that were predicted by MG-RAST to encode protein which were either similar to known annotated proteins or did not share similarity to a known protein sequence in the dsRNA unique reads that did not share any k-mer sequence with microbial DNA, microbial DNA reads (Ion Torrent) or dsRNA reads that shared at least one k-mer sequence with the microbial DNA. D. Taxonomic distribution of dsRNA unique reads with hits to annotated proteins. Pie chart of the percentage of reads with hits to annotated proteins that were assigned to major taxonomic groups including eukaryota, bacteria, archaea, viruses or other (eg. vector sequences) by MG-RAST. (See also Figure S1 and Table S1)

