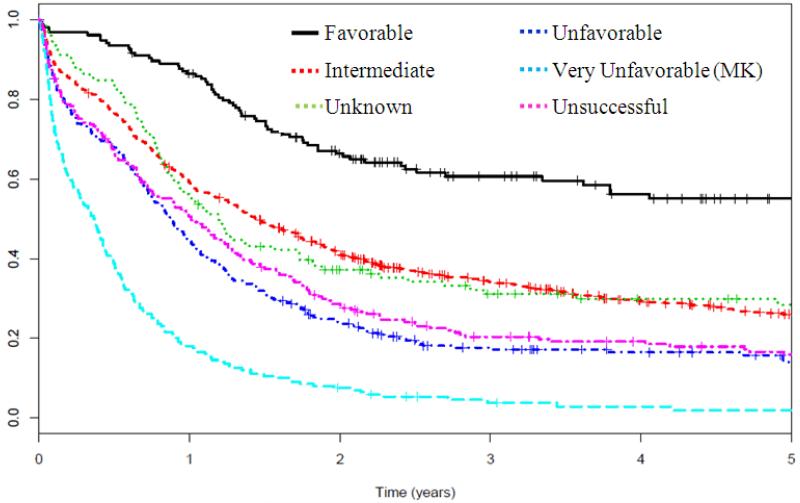
Figure 1.
Five-year overall survival Kaplan-Meier plots according to revised cytogenetic risk category definition
Legend: The cytogenetic risk classification has been previously described by SWOG.5 In brief, it compares the survival outcomes of patients with unsuccessful cytogenetics (magenta dashed) with those in previously described subgroups, including favorable (black solid), intermediate (orange dashed), unknown (green dashed), unfavorable (navy dashed), very unfavorable (light blue dashed).

