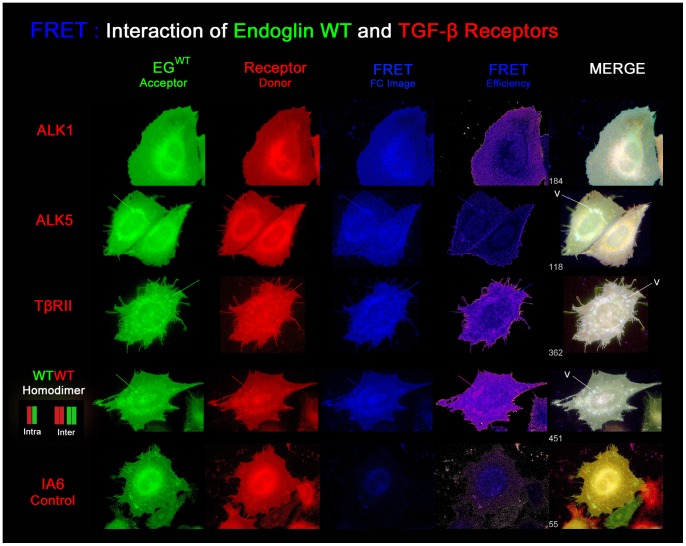
Figure 11. Endoglinwt interacts to different degrees with the TGF-β receptors in the plasma membrane.
Exemplary images of the FRET analysis showing interaction of endoglinwt-EYFP with the TGF-β receptors (ECFP-tagged, false coloured in red). The filter-corrected FRET image (FC) is shown in blue. The calculated FRET efficiency image is shown in an intensity-correlated manner (cold-warm). The 3-channel RGB-merge image becomes white in FRET-positive regions. Interaction is strongest between endoglinwt and TβRII, followed by ALK5 and ALK1. Integrin alpha-6 (ECFP-tagged) does not interact with endoglinwt. In this case the merged image appears yellow. Endoglin homodimers show the strongest interaction due to inter- and intramolecular FRET in vesicles (V). For the other receptors, efficiencies in vesicles are not higher than in the cell membrane, as indicated by lines.

