
Figure 1. Anti-GBM antibody levels from start of immunoadsorption until end of observation.
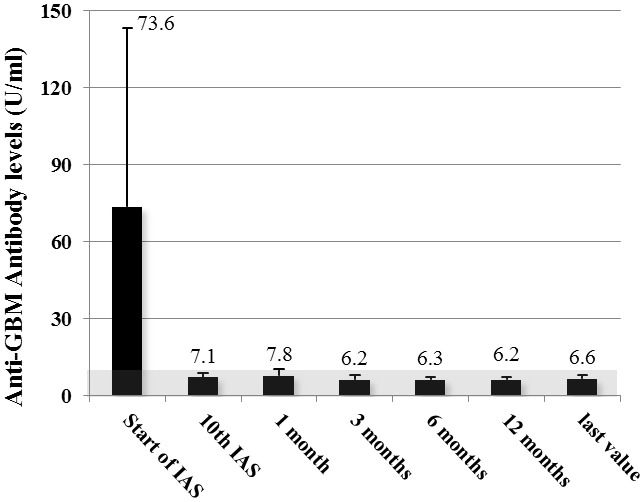
Mean values ± standard deviation of all patients measured with ELISA depicted. Grey area denotes negativity of the assay.
Official websites use .gov
A
.gov website belongs to an official
government organization in the United States.
Secure .gov websites use HTTPS
A lock (
) or https:// means you've safely
connected to the .gov website. Share sensitive
information only on official, secure websites.
Mean values ± standard deviation of all patients measured with ELISA depicted. Grey area denotes negativity of the assay.