
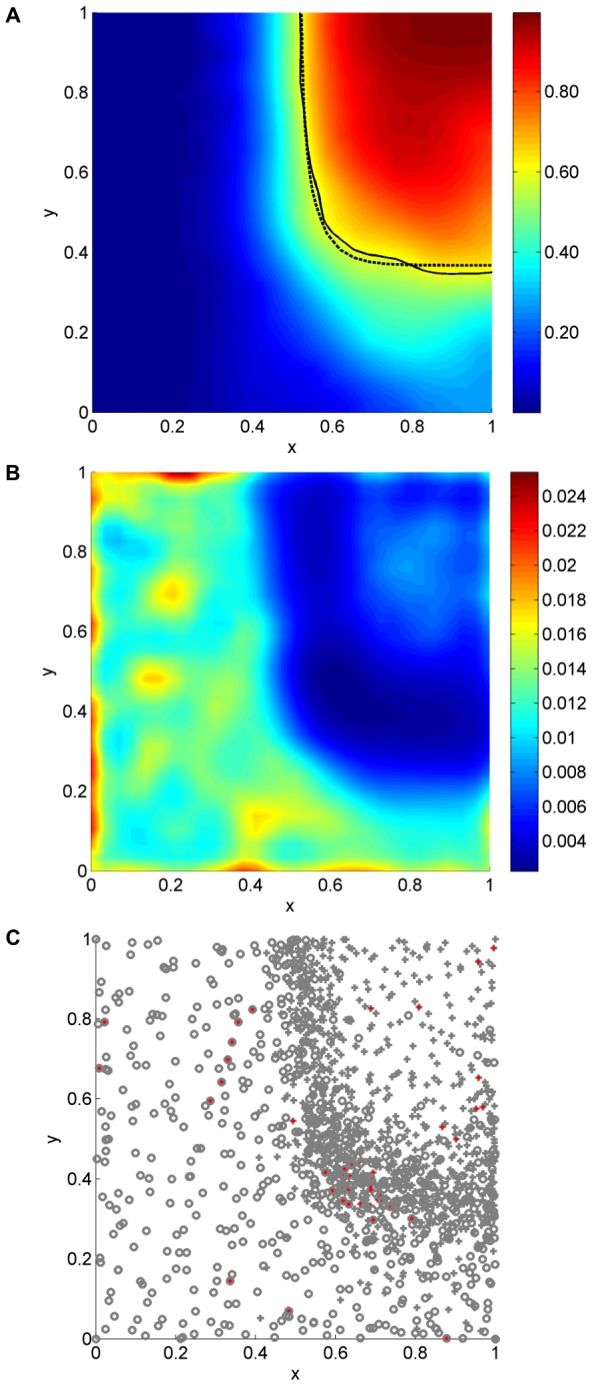
Figure 4. Two-dimensional separatrix results.
The inference algorithm was applied at all points on a regular  grid after collecting
  samples. Here, we display the mode (A), variance (B), and samples (C). The dashed line in (A) is the true separatrix, and the solid line is the estimate. Circles and crosses in (C) represent failures and successes, respectively, and red dots indicate samples selected on the final iteration.