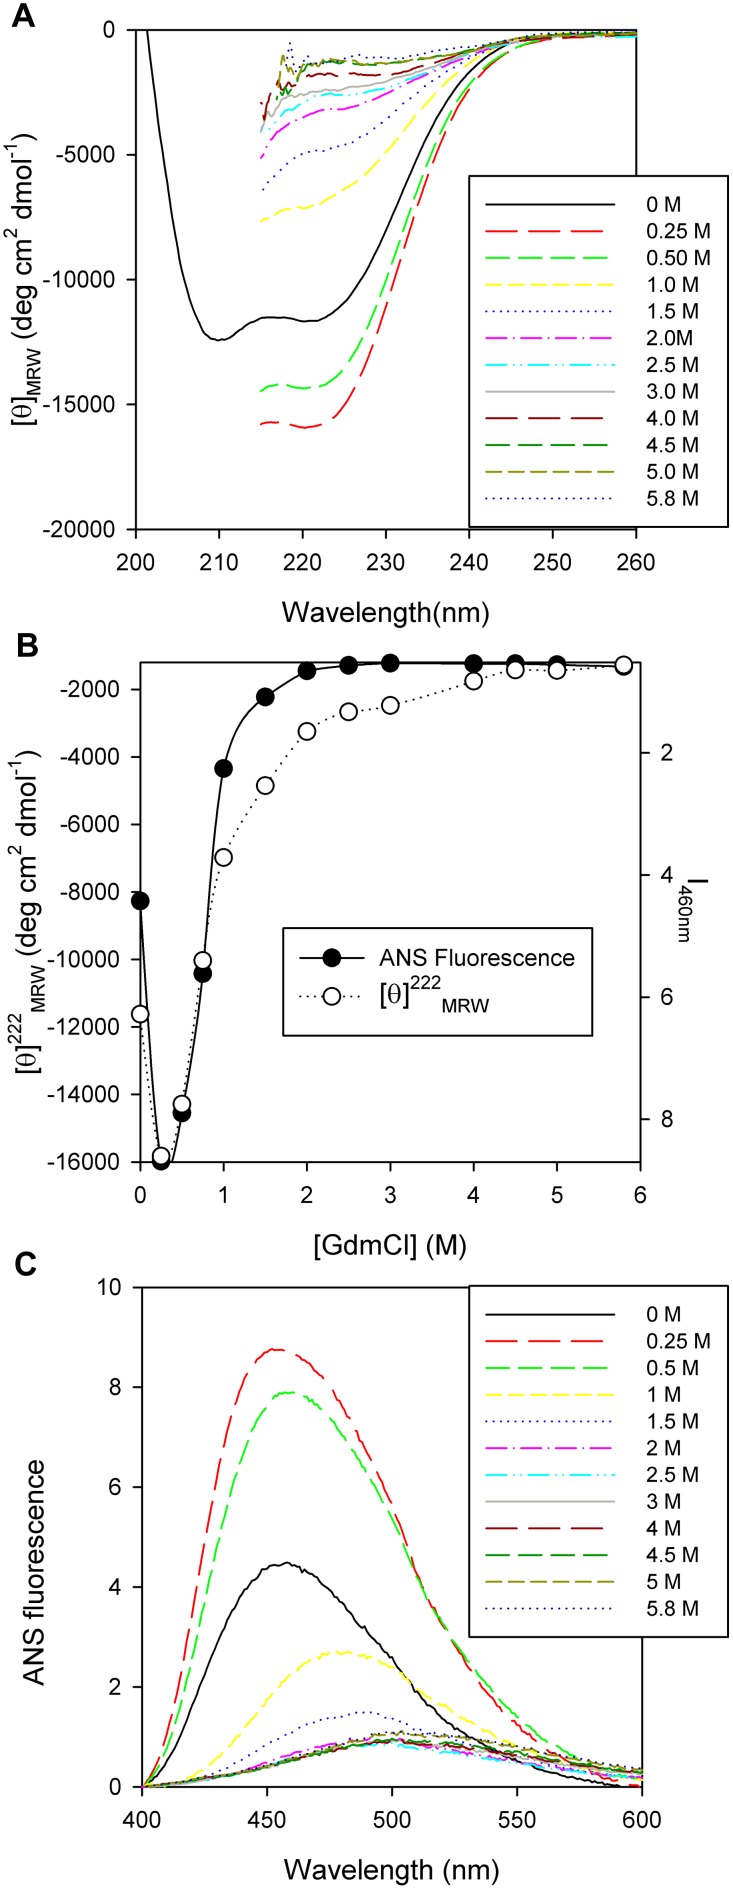
Figure 8. PhaPAz secondary and tertiary/quaternary structural change.
(A) Far-UV CD Spectra of PhaPAz (7 µM) in 20 mM sodium phosphate buffer pH 7.3 containing 50mM NaCl and 1 mM DTT, at different GdmCl concentrations in the range of 0 to 5.8 M. (B) PhaPAz chemical unfolding monitored by fluorescence spectroscopy and CD: (•) ANS fluorescence as a function of GdmCl (○) Molar ellipticity at 222 nm as a function of GdmCl concentration. (C) Fluorescence spectra of ANS binding to PhaPAz (7 µM) treated with different concentrations of GdmCl in the range of 0 to 5.8 M.

