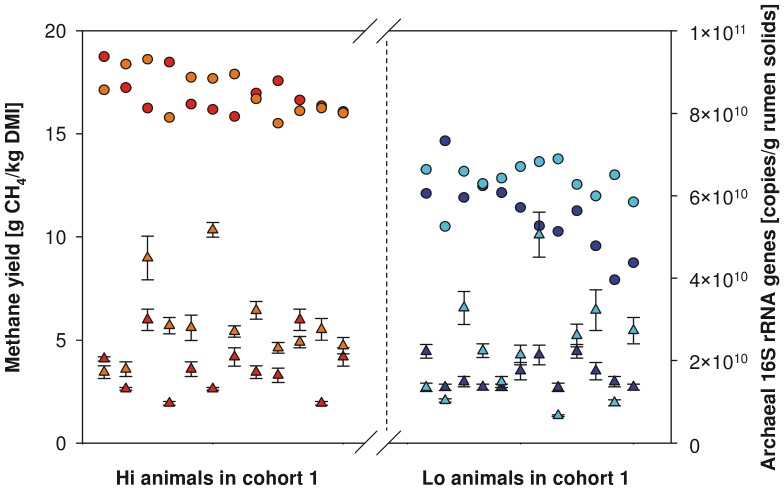
Figure 1. Densities of archaeal 16S rRNA genes in high- and low-CH4 emitting sheep.
Archaeal 16S rRNA genes (triangles) were quantified in 12 randomly-selected Hi and 12 randomly-selected Lo emitters of cohort 1, and are shown with their corresponding average CH4 yields (dots; each the mean of two consecutive days of measurement). Samples are ranked by average CH4 yield. Red triangles = number of archaeal 16S rRNA genes per g freeze-dried rumen content in Hi emitters collected in measuring round [a], orange triangles = number of archaeal 16S rRNA genes per g freeze-dried rumen content in Hi emitters collected in measuring round [b], blue triangles = number of archaeal 16S rRNA genes per g freeze-dried rumen content in Lo emitters collected in measuring round [a], light blue triangles = number of archaeal 16S rRNA genes per g freeze-dried rumen content in Lo emitters collected in measuring round [b]. Red dots = average CH4 yields of Hi emitters in measuring round [a], orange dots = average CH4 yields of Hi emitters in measuring round [b], blue dots = average CH4 yields of Lo emitters in measuring round [a], light blue dots = average CH4 yields of Lo emitters in measuring round [b]. Error bars represent the standard deviations of four technical replicates of quantitative PCR.

