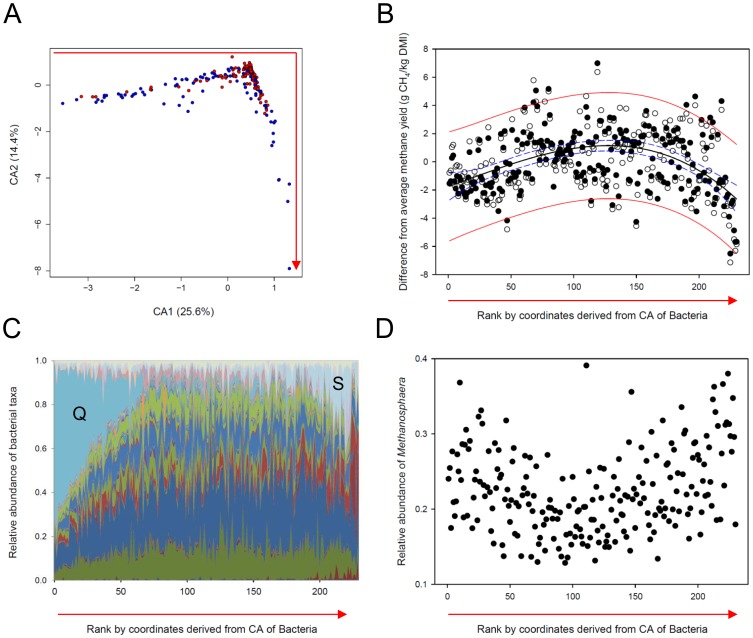
Figure 2. Correlation of rumen microbial community structure with CH4 yields of sheep.
(A) Correspondence analysis of bacterial communities in 230 rumen samples revealed a relative abundance gradient of taxa across all samples. Samples of animals ranked as Lo emitters were represented more strongly at both tips of the graph, whereas samples of animals ranked as Hi emitters grouped more frequently in the center. (B) Differences of individual CH4 yields associated with each sample (n = 230) from the average CH4 yield for all samples (○) or for samples within each measuring round (•). A cubic polynomial function was fitted to the within measuring round data (black solid line), and 95% confidence and prediction bands are indicated as dashed blue and solid red lines, respectively. The samples are ordered from left to right corresponding to the order along the red arrow shown in panel (A). (C) Area plot of relative abundances of bacterial taxa in the 230 rumen samples sorted from left to right along the red arrow in panel (A) from top left to bottom right. The relative community composition in each sample is indicated by the colored segments. Q = Quinella ovalis, S = Sharpea azabuensis. For a detailed color key see Figure S5. (D) Relative abundance of species belonging to the archaeal genus Methanosphaera in 226 rumen samples of Hi and Lo emitters plotted from left to right along the red arrow in panel (A).

