Figure 5.
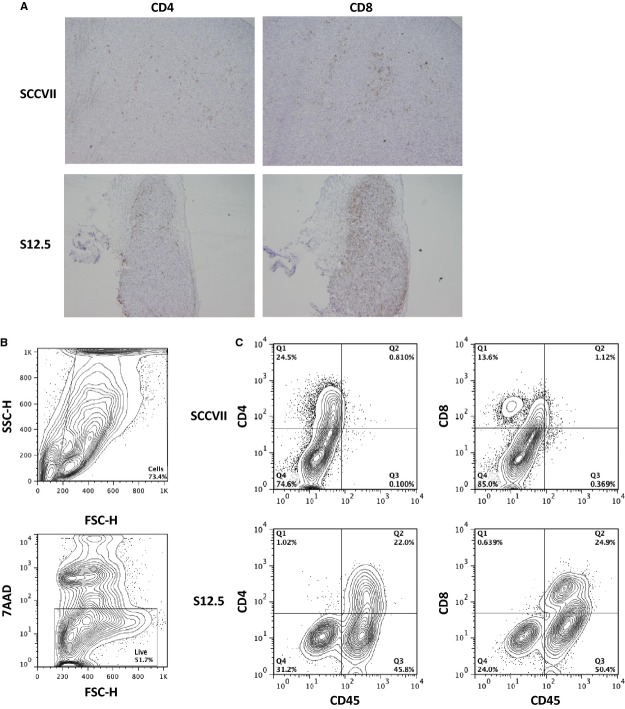
Immunostaining and flow cytometry analysis of tumour isolated from SCCVII or S12.5-injected mice on day 15 post-injection. Experiments were performed three to four times and representative examples presented. (A) Histology sections of tumour isolated from SCCVII (top row) or S12.5 (bottom row) injected mice stained with αCD4 (left column) and αCD8 (right column). All histology sections are shown at 20 × magnification. (B) Gating strategy. Debris was gated out using FSC and SSC, 7AAD was then used to distinguish between live and dead cells. (C) Live cells were analysed on their expression of CD45, CD4 and CD8.

