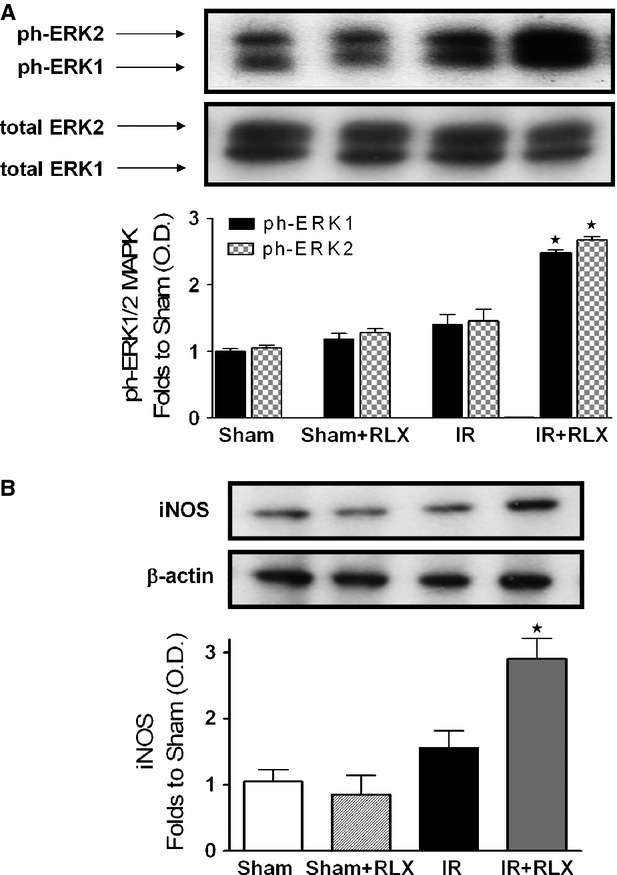
Figure 7.

Effects of I/R and rhRLX on ERK phosphorylation and iNOS expression. Representative Western blot and corresponding densitometric analysis of the bands showing phosphorylated (Thr202/Tyr204) and total ERK1/2 MAPK (A) and iNOS (B) protein expression after 6 hrs of reperfusion in the presence or absence of rhRLX (5 μg/kg, i.v.; Sham+RLX and IR+RLX). Each immunoblot is from a single experiment and is representative of three separate experiments. Densitometric analysis of the related bands is expressed as relative optical density, corrected for the corresponding β-actin contents, and normalized using the related sham-operated band. The data from bands densitometric analysis are means ± SEM of three separate experiments. ⋆P < 0.05 versusIR.
