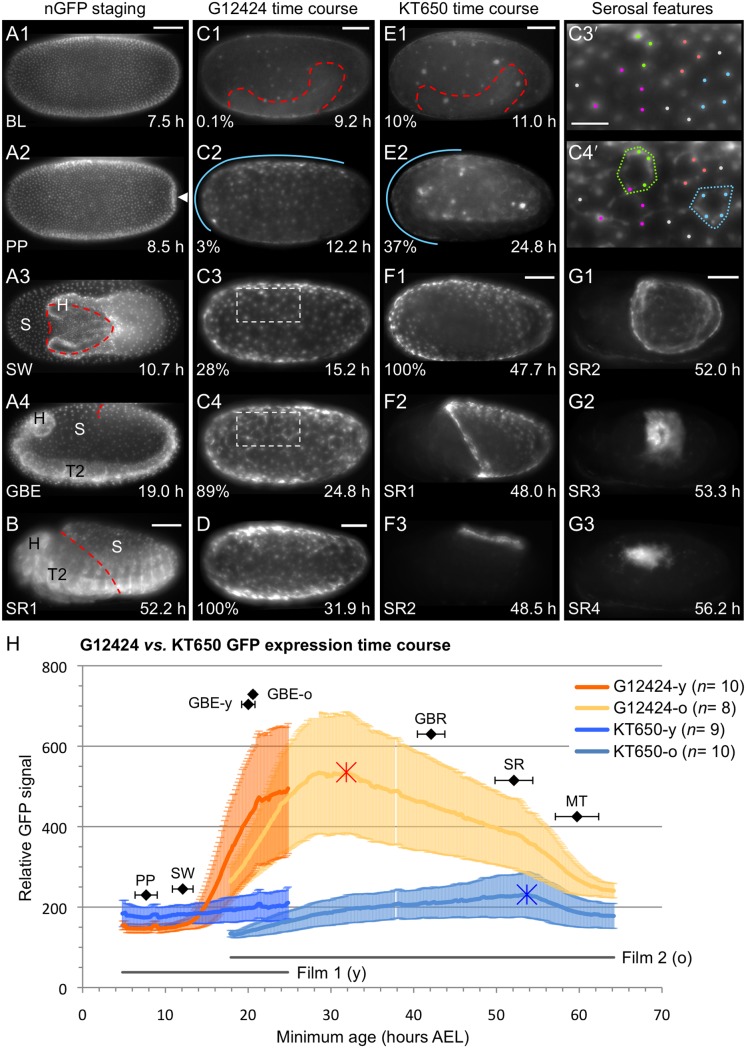
Figure 1. Progression of serosal expression in the lines G12424 and KT650 across embryogenesis.
Live imaging detection of GFP in the transgenic Tribolium lines nGFP, G12424, and KT650. Micrographs labeled with the same letter are of a single embryo. Views are ventral (A1–A3), lateral (A4,B,C,E,F), or dorsal (D,G), with anterior left. (A–B) Exemplar nGFP embryos, illustrating the uniform blastoderm (BL), primitive pit (PP, white arrowhead), closing serosal window (SW), maximum germband extension (GBE), and mid serosal rupture (SR1) stages. Dashed lines label the serosal edge (A3,B) and posterior abdomen (A4). The embryo in panels A1–4 naturally rotated to a lateral view. (C–D) G12424 serosal EGFP increases from shortly after serosal window closure through mid germband retraction. (E–F1) KT650 serosal EGFP increases from shortly after maximum germband extension until just before serosal rupture. Both lines exhibit early EGFP expression in yolk globules (C1,E1: dashed outlines show embryo position, SW stage). The onset of serosal EGFP expression shows an anterior-dorsal or anterior bias (C2,E2: blue lines). During germband retraction, expression in both lines becomes dynamic, with streaks of EGFP between serosal nuclei (shown for G12424: compare C3′ and C4′, dots mark selected nuclei). (F2–G3) In both lines, serosal expression persists throughout the lifetime of the tissue (shown for KT650: sequential stages following serosal rupture, SR1-4, through tissue degeneration). Percentage values (C–F1) denote normalized EGFP intensity for each line. Time stamps show embryo minimum age (at 30°C). Anatomical abbreviations: H, head; S, serosa; T(x), thoracic segment (x). Scale bars are 100 µm, except for 50 µm in C3′. (H) Quantification of EGFP expression time courses, showing the mean ± standard deviation, with sample sizes indicated in the legend. Asterisks mark the maximum EGFP signal. Also plotted are the durations of the two films (younger, “y”; older, “o”: grey lines) and the morphological stages defined in Table 3 (black plot points). See Methods for details.

