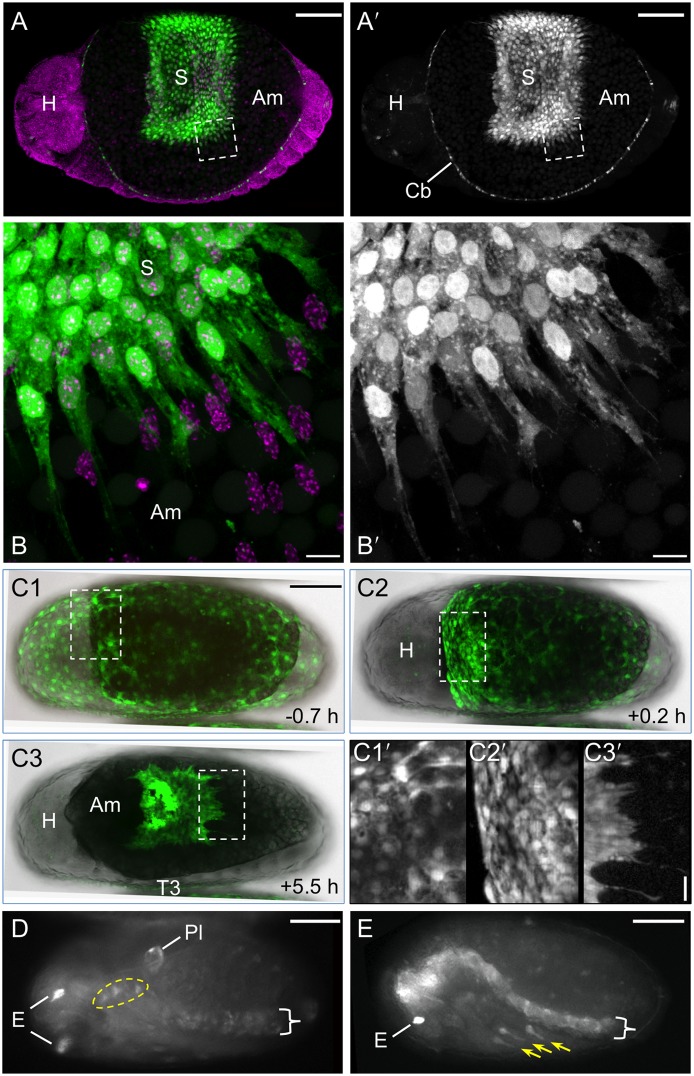
Figure 2. Specific expression features for the lines G12424 and KT650.
Views are dorsal (A–C), ventral-lateral (D), or lateral (E), with anterior left. (A–C) In both lines EGFP (green; white in single-channel images) fills serosal cells, showing the nucleus and cytoplasmic protrusions or overall cell shapes (A–B: G12424×G04609-mesodermal heterozygote: EGFP in the cardioblasts (Cb) is from the G04609 line, described below; C: KT650). EGFP expression throughout the serosa (S) clearly demarcates the tissue boundary with the unlabeled amnion (Am). In fixed specimens (A–B) a nuclear counterstain in shown is magenta. In live imaging panels (C1–C3), whole mount views merge the EGFP and transmitted light channels: the opaque yolk appears black and the embryonic tissue is light grey. Time stamps in C1–C3 are relative to serosal rupture (at 24°C). Inset images C1′–C3′ show details of cell shapes: orderly polygons over the embryo (left) and more irregular apical areas over the yolk (right) in the pre-rupture serosa (C1′); at the anterior edge of the serosa during early contraction (C2′); and at the posterior edge as the serosa begins to degenerate, with trailing cytoplasmic extensions (C3′). See also Movie S1. (D–E) In addition to serosal expression, both lines exhibit late embryonic expression. EGFP in the eyes (E) and ventral nerve cord (curly brackets) is the result of the 3xP3 promoter within the transposon and is not line specific. Line G12424 (panel D) exhibits EGFP in the pleuropodia (Pl) and a small proximal region of the legs (dashed yellow outline encompasses T1–T3), while line KT650 (panel E) has expression in the distal portion of the legs (yellow arrows) and strongly in the central nervous system, including the brain and at heightened levels in the ventral nerve cord compared to 3xP3 expression alone. Scale bars are 100 µm for all whole mount images; for the inset images, scale bars are 10 µm (B) and 20 µm (C1′-C3′).

