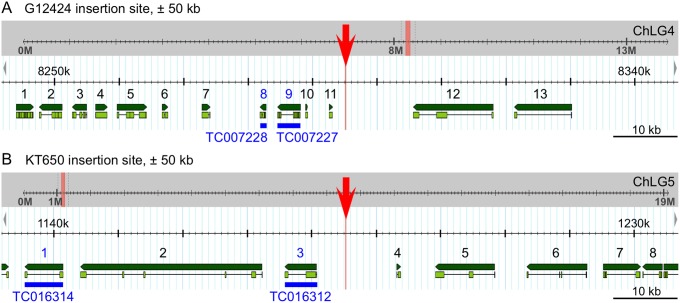
Figure 3. Genomic mapping of the serosal lines G12424 (A) and KT650 (B).
Genome browser views (version Tcas_3.0) show the insertion site (red) within the context of the entire chromosomal linkage group (ChLG, grey background) and enlarged for the region ±50 kb from the insertion site (white background). Predicted genes (Tcas_3.0 official gene set) within this region are numbered and shown in green (dark green: entire gene, light green: exons); see Tables 2 and 3 for details of specific genes. Candidate genes inspected by in situ hybridization are labeled in blue.

