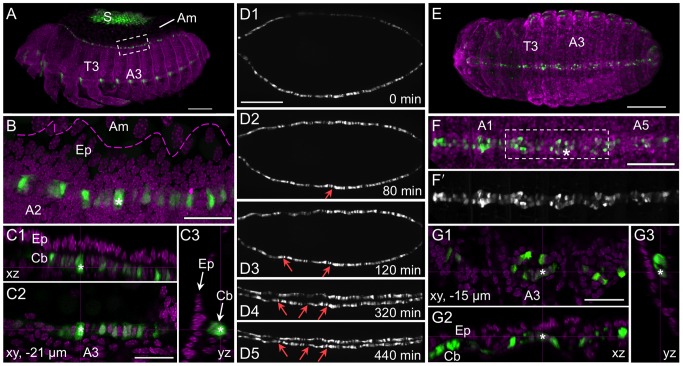
Figure 6. Mesodermal expression in the line G04609: heart anatomical details.
For the retracted germband (A–C), dorsal closure (D), and post-dorsal closure (E–G) stages, representative embryos are shown with G04609-mesodermal×G12424-serosal heterozygote (A–C,E–G) or G04609 homozygote (D) EGFP expression (green; white in single-channel images) and a nuclear counterstain in fixed specimens (magenta). The serosa is visible in panel A only. Throughout these stages, G04609 heart EGFP is stably expressed in a subset of cardioblast cells, near to the dorsal epidermis-amnion boundary (B: dashed magenta line approximation, based on [16]) and directly below the epidermis (C1–C3,G1–G3). As heart formation progresses during dorsal closure, small bends form in the cardioblast cell row (D2–D5: red arrows), reflecting the overall scalloped, or wavy, geometry of dorsal closure (compare with shape of dashed line in B). Note that in D1 the upper cell row is not yet fully in view due to the slightly oblique angle. Views are lateral (A–C) or dorsal (D–G), with anterior left. All views are maximum intensity projections except C1–C3 and G1–G3 provide orthogonal views of a single plane (depth below surface is indicated in the xy panel: C2,G1). Boxed regions in A and F correspond to panels B and G, respectively. The focal point for orthogonal views is indicated by a white asterisk (B–C,F–G). Time stamps in D1–D5 show elapsed time from start of filming (at 24°C). Abbreviations: A(x), abdominal segment (x); Am, Amnion; Cb, cardioblasts; Ep, epidermis; S, serosa; T(x), thoracic segment (x). Scale bars are 100 µm (A,D,E), 20 µm (B,C,G), and 50 µm (F).

