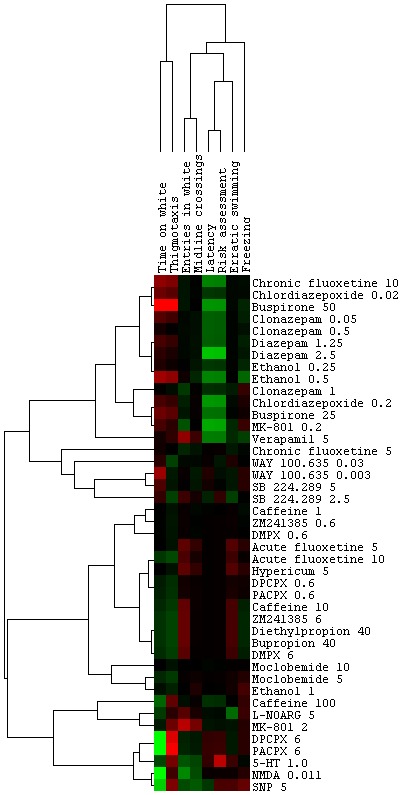
Figure 1. Behavioral fingerprint of selected drugs on the scototaxis test.

Pharmacological manipulations were hierarchically clustered to link compounds to behaviors. In the clustergram, each cell represents the Maximum Predictive Value (red – higher than controls; green – lower than controls).
