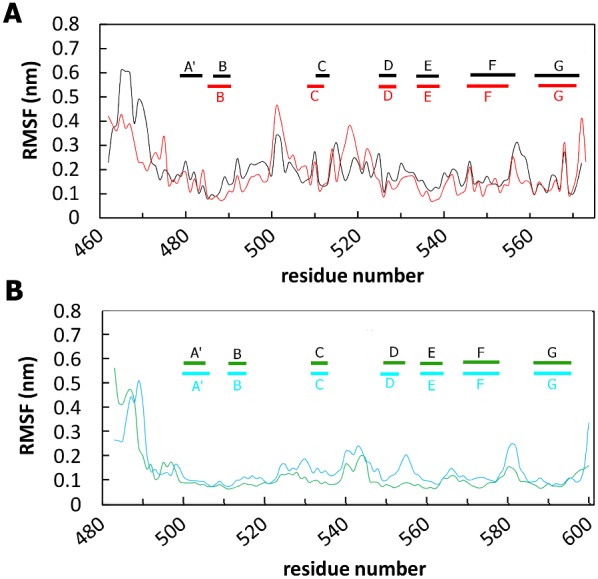
Figure 4. Cα-RMSF values averaged per each residue over the last 30 ns of MD trajectory.

Wild-type (black) and V567D (red) zebrafish simulations are shown in panel A; wild-type (green) and I591D (light blue) murine simulations are shown in panel B. Only the protein region spanning the Ig-like domain is shown.
