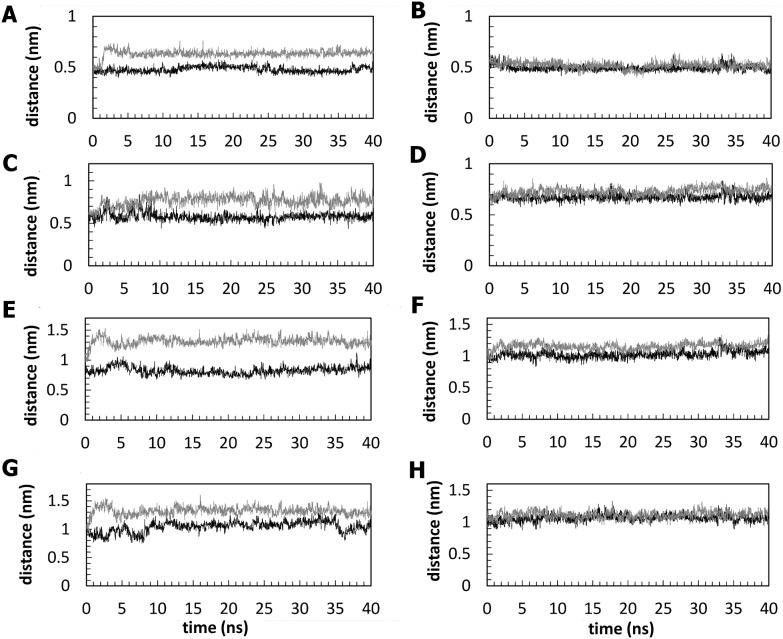
Figure 7. Distance analysis between the A′–G and the B–G strands.
Time evolution of the distances between Cα atoms of zebrafish residue pairs 481–567 (panel A), 483–567 (panel C), 489–567 (panel E) and 491–567 (panel G) and of murine residue pairs 504–591 (panel B), 506–591 (panel D), 512–591 (panel F) and 514–591 (panel H). The black and gray lines show the trajectories for wild-type and mutant systems, respectively.

