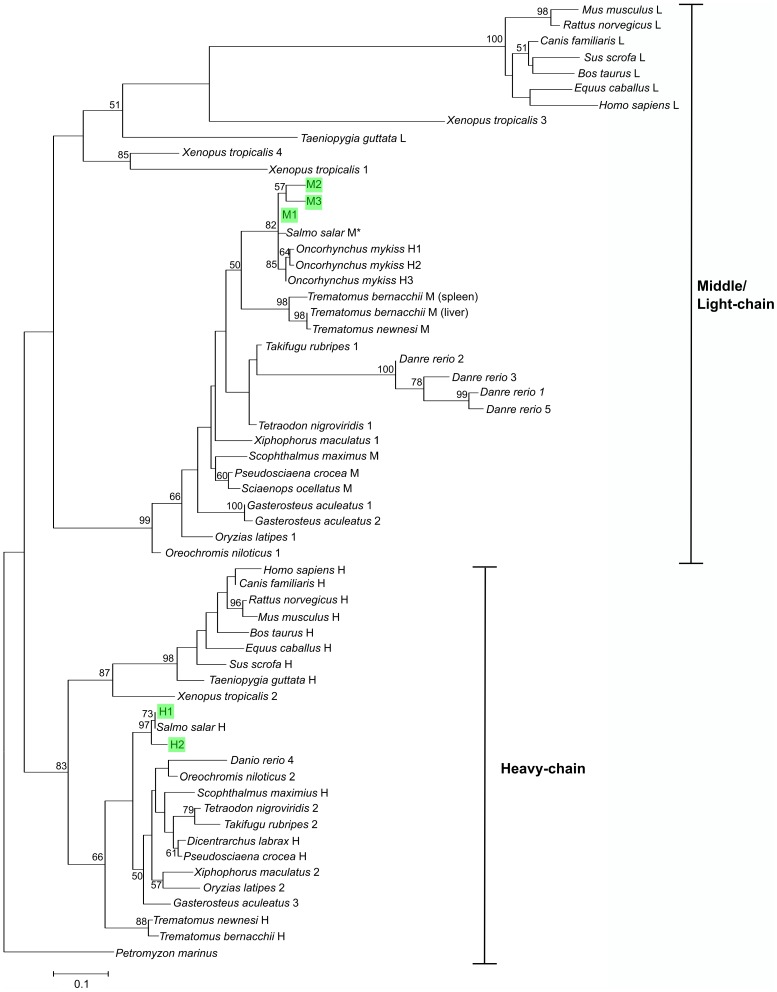
Figure 3. Maximum Likelihood tree generated from amino acid sequences of vertebrate ferritins.
The various ferritin sequences are clustered according to chain types, with heavy(H)-chains forming an orthologous group to the middle (M)/light(L)-chains. Ferritin sequences from S. salar (H1, H2, M1, M2, M3) characterised in this study are highlighted in green, while previously reported sequences [13] are indicated with (*). Values at nodes indicate the Maximum-Likelihood bootstrap percentages (1000 replications). The scale bar represents the estimated number of substitutions per site.

