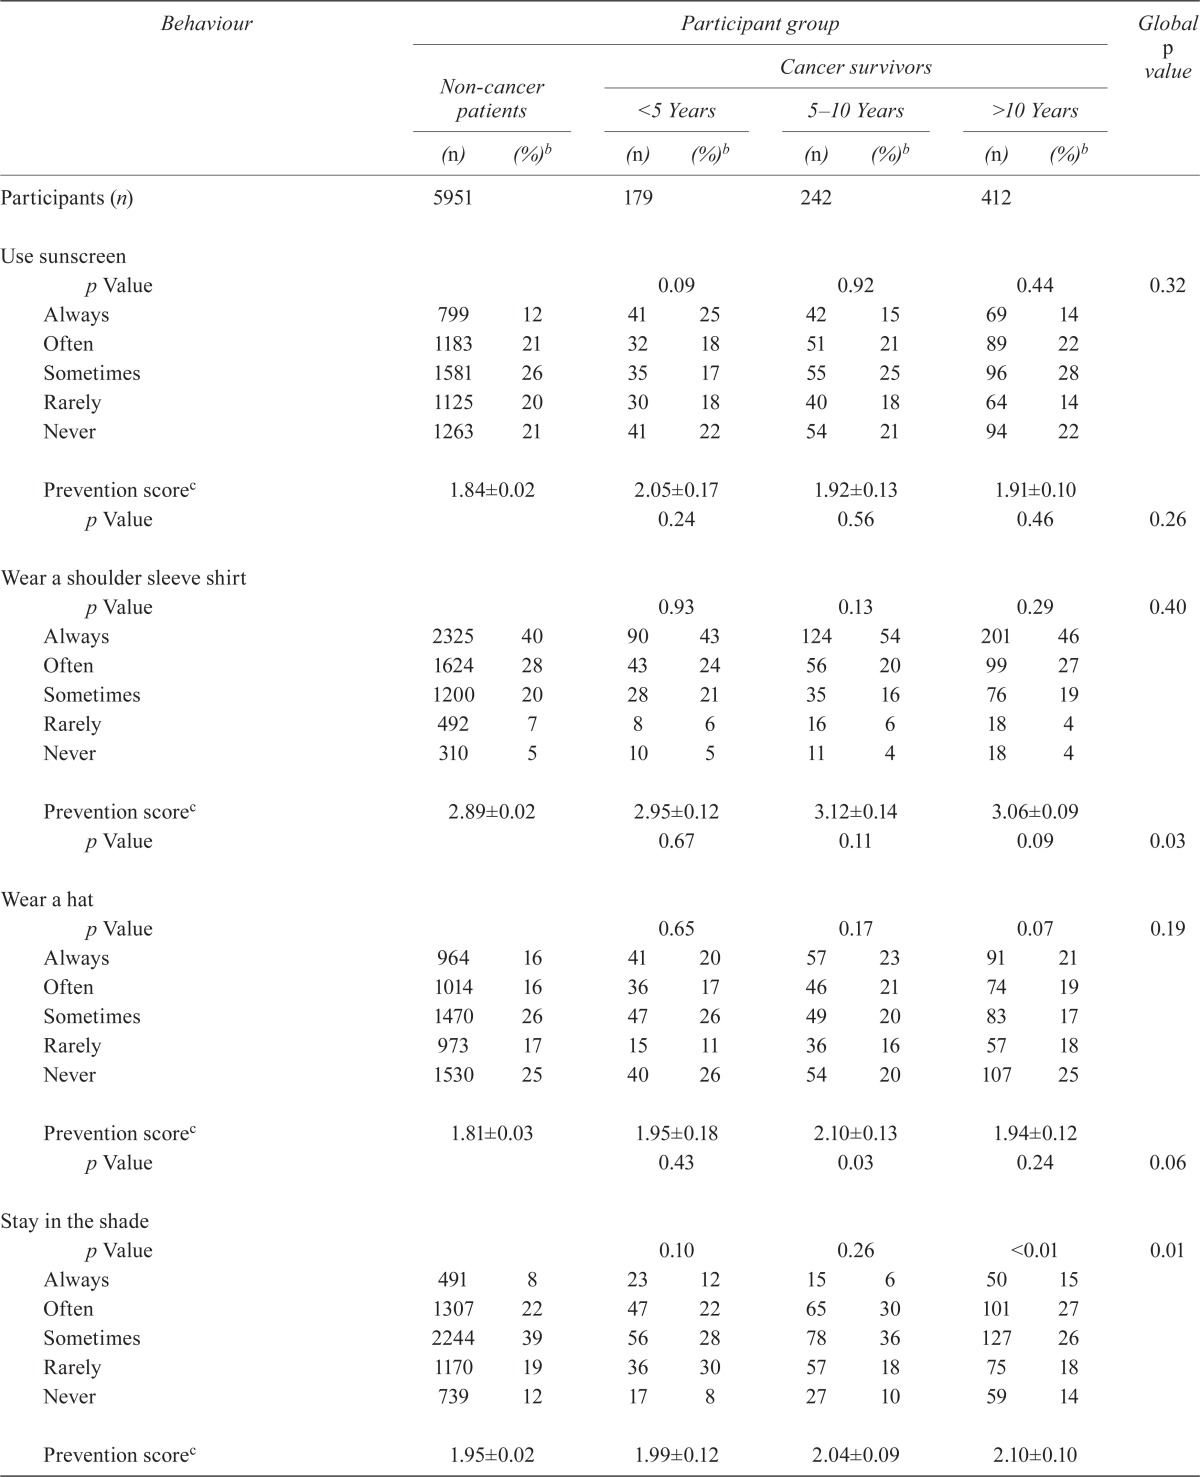
TABLE II.
Patterns of sun-protective behavior and preventive and composite preventive scores in cancer survivors and non-cancer patients

| Behaviour |
Participant group
|
Global p value | |||||||
|---|---|---|---|---|---|---|---|---|---|
|
Non-cancer patients
|
Cancer survivors
|
||||||||
|
<5 Years
|
5–10 Years
|
>10 Years
|
|||||||
| (n) | (%)b | (n) | (%)b | (n) | (%)b | (n) | (%)b | ||
| Participants (n) | 5951 | 179 | 242 | 412 | |||||
| Use sunscreen | |||||||||
| p Value | 0.09 | 0.92 | 0.44 | 0.32 | |||||
| Always | 799 | 12 | 41 | 25 | 42 | 15 | 69 | 14 | |
| Often | 1183 | 21 | 32 | 18 | 51 | 21 | 89 | 22 | |
| Sometimes | 1581 | 26 | 35 | 17 | 55 | 25 | 96 | 28 | |
| Rarely | 1125 | 20 | 30 | 18 | 40 | 18 | 64 | 14 | |
| Never | 1263 | 21 | 41 | 22 | 54 | 21 | 94 | 22 | |
| Prevention scorec | 1.84±0.02 | 2.05±0.17 | 1.92±0.13 | 1.91±0.10 | |||||
| p Value | 0.24 | 0.56 | 0.46 | 0.26 | |||||
| Wear a shoulder sleeve shirt | |||||||||
| p Value | 0.93 | 0.13 | 0.29 | 0.40 | |||||
| Always | 2325 | 40 | 90 | 43 | 124 | 54 | 201 | 46 | |
| Often | 1624 | 28 | 43 | 24 | 56 | 20 | 99 | 27 | |
| Sometimes | 1200 | 20 | 28 | 21 | 35 | 16 | 76 | 19 | |
| Rarely | 492 | 7 | 8 | 6 | 16 | 6 | 18 | 4 | |
| Never | 310 | 5 | 10 | 5 | 11 | 4 | 18 | 4 | |
| Prevention scorec | 2.89±0.02 | 2.95±0.12 | 3.12±0.14 | 3.06±0.09 | |||||
| p Value | 0.67 | 0.11 | 0.09 | 0.03 | |||||
| Wear a hat | |||||||||
| p Value | 0.65 | 0.17 | 0.07 | 0.19 | |||||
| Always | 964 | 16 | 41 | 20 | 57 | 23 | 91 | 21 | |
| Often | 1014 | 16 | 36 | 17 | 46 | 21 | 74 | 19 | |
| Sometimes | 1470 | 26 | 47 | 26 | 49 | 20 | 83 | 17 | |
| Rarely | 973 | 17 | 15 | 11 | 36 | 16 | 57 | 18 | |
| Never | 1530 | 25 | 40 | 26 | 54 | 20 | 107 | 25 | |
| Prevention scorec | 1.81±0.03 | 1.95±0.18 | 2.10±0.13 | 1.94±0.12 | |||||
| p Value | 0.43 | 0.03 | 0.24 | 0.06 | |||||
| Stay in the shade | |||||||||
| p Value | 0.10 | 0.26 | <0.01 | 0.01 | |||||
| Always | 491 | 8 | 23 | 12 | 15 | 6 | 50 | 15 | |
| Often | 1307 | 22 | 47 | 22 | 65 | 30 | 101 | 27 | |
| Sometimes | 2244 | 39 | 56 | 28 | 78 | 36 | 127 | 26 | |
| Rarely | 1170 | 19 | 36 | 30 | 57 | 18 | 75 | 18 | |
| Never | 739 | 12 | 17 | 8 | 27 | 10 | 59 | 14 | |
| Prevention scorec | 1.95±0.02 | 1.99±0.12 | 2.04±0.09 | 2.10±0.10 | |||||
| Used a tanning bed in the preceding 12 months | |||||||||
| p Value | <0.01 | 0.02 | 0.06 | <0.01 | |||||
| Yes | 399 | 6 | 3 1 | 8 2 | 13 3 | ||||
| No | 5552 | 94 | 176 | 99 | 234 | 98 | 399 | 97 | |
| Composite prevention scorec | 8.49±0.05 | 8.93±0.38 | 9.18±0.36 | 9.02±0.23 | |||||
| p Value | 0.25 | 0.06 | 0.03 | <0.01 | |||||
From the U.S. Health Information National Trends Survey (hints), 2009.
All percentages are weighted.
Mean ± standard error.
