
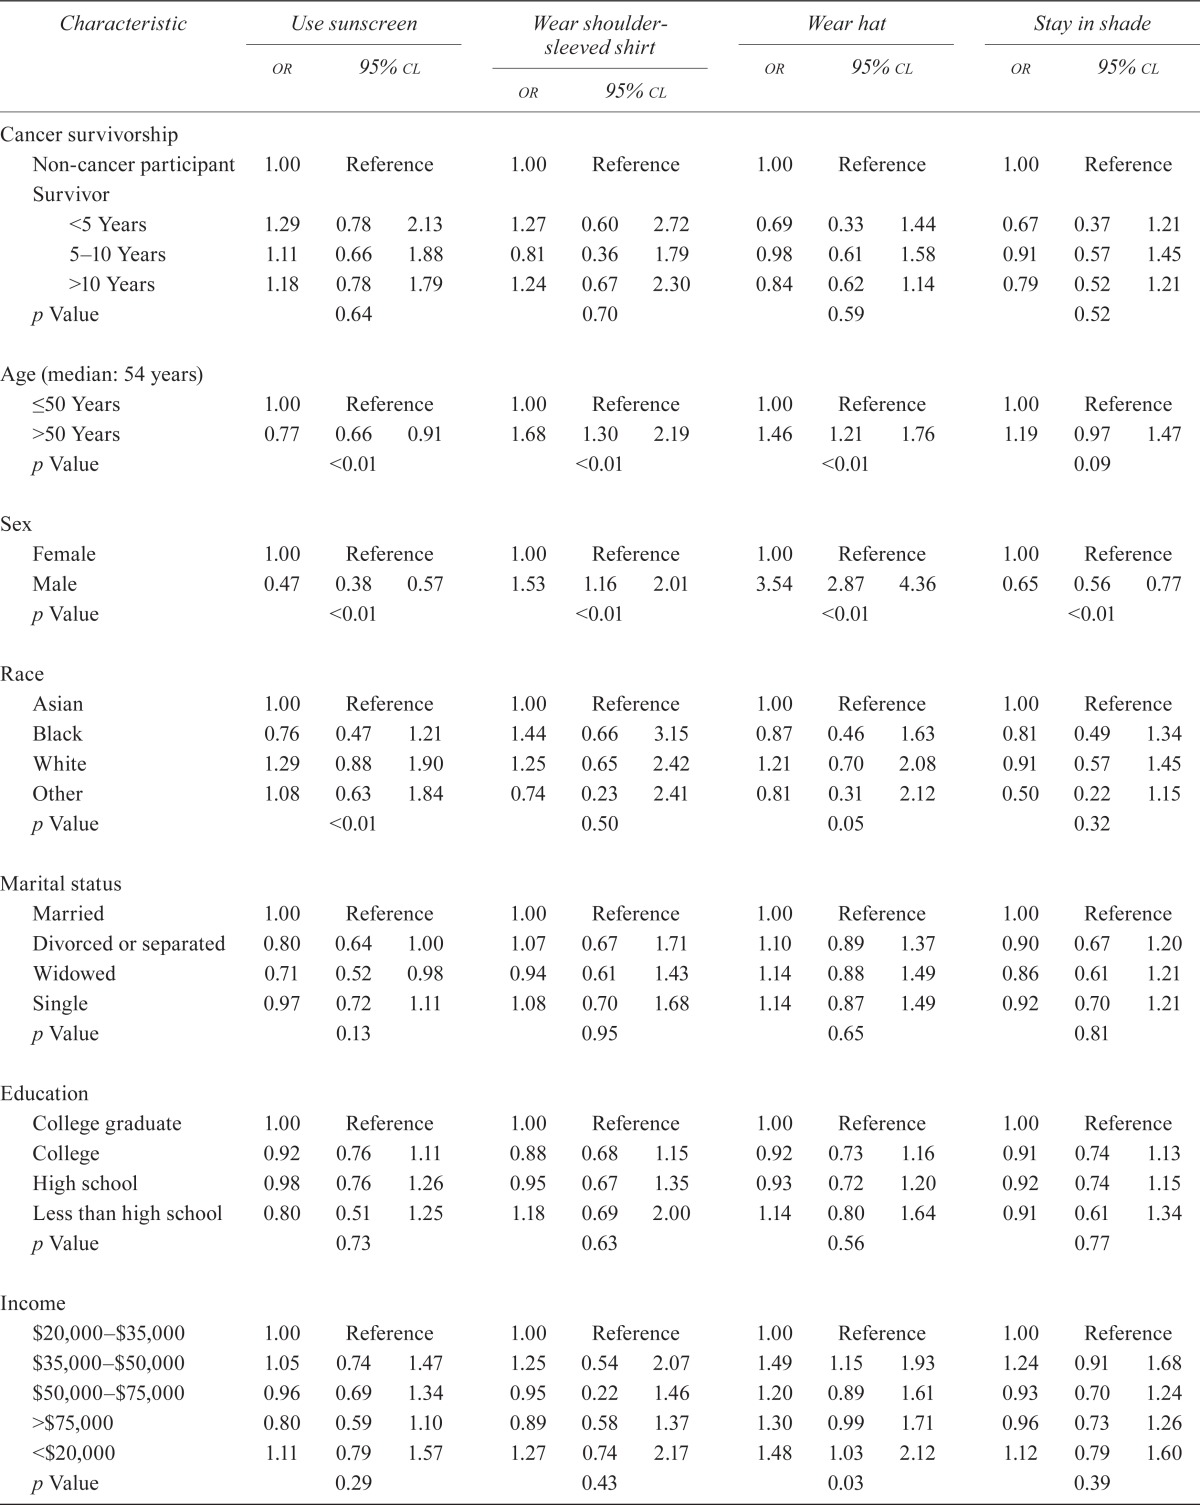
TABLE III.
Association of clinical characteristics with odds of using various sun-protection strategiesa
| Characteristic |
Use sunscreen
|
Wear shoulder-sleeved shirt
|
Wear hat
|
Stay in shade
|
||||||||
|---|---|---|---|---|---|---|---|---|---|---|---|---|
| or | 95% cl | or | 95% cl | or | 95% cl | or | 95% cl | |||||
| Cancer survivorship | ||||||||||||
| Non-cancer participant | 1.00 | Reference | 1.00 | Reference | 1.00 | Reference | 1.00 | Reference | ||||
| Survivor | ||||||||||||
| <5 Years | 1.29 | 0.78 | 2.13 | 1.27 | 0.60 | 2.72 | 0.69 | 0.33 | 1.44 | 0.67 | 0.37 | 1.21 |
| 5–10 Years | 1.11 | 0.66 | 1.88 | 0.81 | 0.36 | 1.79 | 0.98 | 0.61 | 1.58 | 0.91 | 0.57 | 1.45 |
| >10 Years | 1.18 | 0.78 | 1.79 | 1.24 | 0.67 | 2.30 | 0.84 | 0.62 | 1.14 | 0.79 | 0.52 | 1.21 |
| p Value | 0.64 | 0.70 | 0.59 | 0.52 | ||||||||
| Age (median: 54 years) | ||||||||||||
| ≤50 Years | 1.00 | Reference | 1.00 | Reference | 1.00 | Reference | 1.00 | Reference | ||||
| >50 Years | 0.77 | 0.66 | 0.91 | 1.68 | 1.30 | 2.19 | 1.46 | 1.21 | 1.76 | 1.19 | 0.97 | 1.47 |
| p Value | <0.01 | <0.01 | <0.01 | 0.09 | ||||||||
| Sex | ||||||||||||
| Female | 1.00 | Reference | 1.00 | Reference | 1.00 | Reference | 1.00 | Reference | ||||
| Male | 0.47 | 0.38 | 0.57 | 1.53 | 1.16 | 2.01 | 3.54 | 2.87 | 4.36 | 0.65 | 0.56 | 0.77 |
| p Value | <0.01 | <0.01 | <0.01 | <0.01 | ||||||||
| Race | ||||||||||||
| Asian | 1.00 | Reference | 1.00 | Reference | 1.00 | Reference | 1.00 | Reference | ||||
| Black | 0.76 | 0.47 | 1.21 | 1.44 | 0.66 | 3.15 | 0.87 | 0.46 | 1.63 | 0.81 | 0.49 | 1.34 |
| White | 1.29 | 0.88 | 1.90 | 1.25 | 0.65 | 2.42 | 1.21 | 0.70 | 2.08 | 0.91 | 0.57 | 1.45 |
| Other | 1.08 | 0.63 | 1.84 | 0.74 | 0.23 | 2.41 | 0.81 | 0.31 | 2.12 | 0.50 | 0.22 | 1.15 |
| p Value | <0.01 | 0.50 | 0.05 | 0.32 | ||||||||
| Marital status | ||||||||||||
| Married | 1.00 | Reference | 1.00 | Reference | 1.00 | Reference | 1.00 | Reference | ||||
| Divorced or separated | 0.80 | 0.64 | 1.00 | 1.07 | 0.67 | 1.71 | 1.10 | 0.89 | 1.37 | 0.90 | 0.67 | 1.20 |
| Widowed | 0.71 | 0.52 | 0.98 | 0.94 | 0.61 | 1.43 | 1.14 | 0.88 | 1.49 | 0.86 | 0.61 | 1.21 |
| Single | 0.97 | 0.72 | 1.11 | 1.08 | 0.70 | 1.68 | 1.14 | 0.87 | 1.49 | 0.92 | 0.70 | 1.21 |
| p Value | 0.13 | 0.95 | 0.65 | 0.81 | ||||||||
| Education | ||||||||||||
| College graduate | 1.00 | Reference | 1.00 | Reference | 1.00 | Reference | 1.00 | Reference | ||||
| College | 0.92 | 0.76 | 1.11 | 0.88 | 0.68 | 1.15 | 0.92 | 0.73 | 1.16 | 0.91 | 0.74 | 1.13 |
| High school | 0.98 | 0.76 | 1.26 | 0.95 | 0.67 | 1.35 | 0.93 | 0.72 | 1.20 | 0.92 | 0.74 | 1.15 |
| Less than high school | 0.80 | 0.51 | 1.25 | 1.18 | 0.69 | 2.00 | 1.14 | 0.80 | 1.64 | 0.91 | 0.61 | 1.34 |
| p Value | 0.73 | 0.63 | 0.56 | 0.77 | ||||||||
| Income | ||||||||||||
| $20,000–$35,000 | 1.00 | Reference | 1.00 | Reference | 1.00 | Reference | 1.00 | Reference | ||||
| $35,000–$50,000 | 1.05 | 0.74 | 1.47 | 1.25 | 0.54 | 2.07 | 1.49 | 1.15 | 1.93 | 1.24 | 0.91 | 1.68 |
| $50,000–$75,000 | 0.96 | 0.69 | 1.34 | 0.95 | 0.22 | 1.46 | 1.20 | 0.89 | 1.61 | 0.93 | 0.70 | 1.24 |
| >$75,000 | 0.80 | 0.59 | 1.10 | 0.89 | 0.58 | 1.37 | 1.30 | 0.99 | 1.71 | 0.96 | 0.73 | 1.26 |
| <$20,000 | 1.11 | 0.79 | 1.57 | 1.27 | 0.74 | 2.17 | 1.48 | 1.03 | 2.12 | 1.12 | 0.79 | 1.60 |
| p Value | 0.29 | 0.43 | 0.03 | 0.39 | ||||||||
| Smoking status | ||||||||||||
| Smoker | 1.00 | Reference | 1.00 | Reference | 1.00 | Reference | 1.00 | Reference | ||||
| Never smoked | 1.16 | 0.96 | 1.41 | 0.94 | 0.74 | 1.17 | 1.05 | 0.88 | 1.25 | 1.06 | 0.89 | 1.27 |
| p Value | 0.13 | 0.57 | 0.57 | 0.49 | ||||||||
| General health | ||||||||||||
| Excellent | 1.00 | Reference | 1.00 | Reference | 1.00 | Reference | 1.00 | Reference | ||||
| Very good | 0.98 | 0.78 | 1.23 | 0.92 | 0.69 | 1.22 | 1.04 | 0.76 | 1.42 | 0.92 | 0.69 | 1.23 |
| Fair | 1.47 | 1.08 | 2.01 | 1.10 | 0.71 | 1.69 | 1.01 | 0.69 | 1.47 | 1.07 | 0.76 | 1.51 |
| Good | 0.90 | 0.69 | 1.17 | 0.99 | 0.72 | 1.35 | 1.16 | 0.86 | 1.55 | 0.92 | 0.68 | 1.26 |
| Poor | 0.80 | 0.52 | 1.23 | 0.60 | 0.30 | 1.20 | 1.15 | 0.66 | 1.99 | 1.02 | 0.60 | 1.73 |
| p Value | <0.01 | 0.43 | 0.73 | 0.80 | ||||||||
a
From the U.S. Health Information National Trends Survey (hints), 2009.
or = odds ratio; cl = confidence limits.