
TABLE V.
Results of studies of patients with multiple myeloma
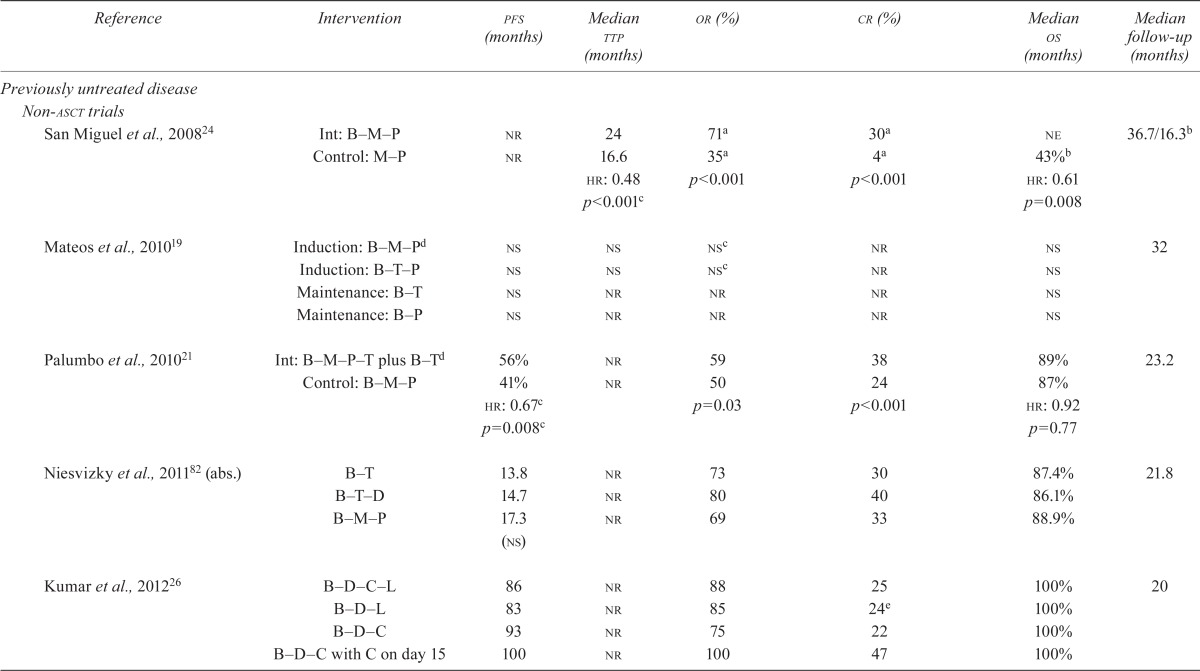
| Reference | Intervention | pfs (months) | Median ttp (months) | or (%) | cr (%) | Median os (months) | Median follow-up (months) |
|---|---|---|---|---|---|---|---|
| Previously untreated disease | |||||||
| Non-asct trials | |||||||
| San Miguel et al., 200824 | Int: B–M–P | nr | 24 | 71a | 30a | ne | 36.7/16.3b |
| Control: M–P | nr | 16.6 | 35a | 4a | 43%b | ||
| hr: 0.48 | p<0.001 | p<0.001 | hr: 0.61 | ||||
| p<0.001c | p=0.008 | ||||||
| Mateos et al., 201019 | Induction: B–M–Pd | ns | ns | nsc | nr | ns | 32 |
| Induction: B–T–P | ns | ns | nsc | nr | ns | ||
| Maintenance: B–T | ns | nr | nr | nr | ns | ||
| Maintenance: B–P | ns | nr | nr | nr | ns | ||
| Palumbo et al., 201021 | Int: B–M–P–T plus B–Td | 56% | nr | 59 | 38 | 89% | 23.2 |
| Control: B–M–P | 41% | nr | 50 | 24 | 87% | ||
| hr: 0.67c | p=0.03 | p<0.001 | hr: 0.92 | ||||
| p=0.008c | p=0.77 | ||||||
| Niesvizky et al., 201182 (abs.) | B–T | 13.8 | nr | 73 | 30 | 87.4% | 21.8 |
| B–T–D | 14.7 | nr | 80 | 40 | 86.1% | ||
| B–M–P | 17.3 (ns) | nr | 69 | 33 | 88.9% | ||
| Kumar et al., 201226 | B–D–C–L | 86 | nr | 88 | 25 | 100% | 20 |
| B–D–L | 83 | nr | 85 | 24e | 100% | ||
| B–D–C | 93 | nr | 75 | 22 | 100% | ||
| B–D–C with C on day 15 | 100 | nr | 100 | 47 | 100% | ||
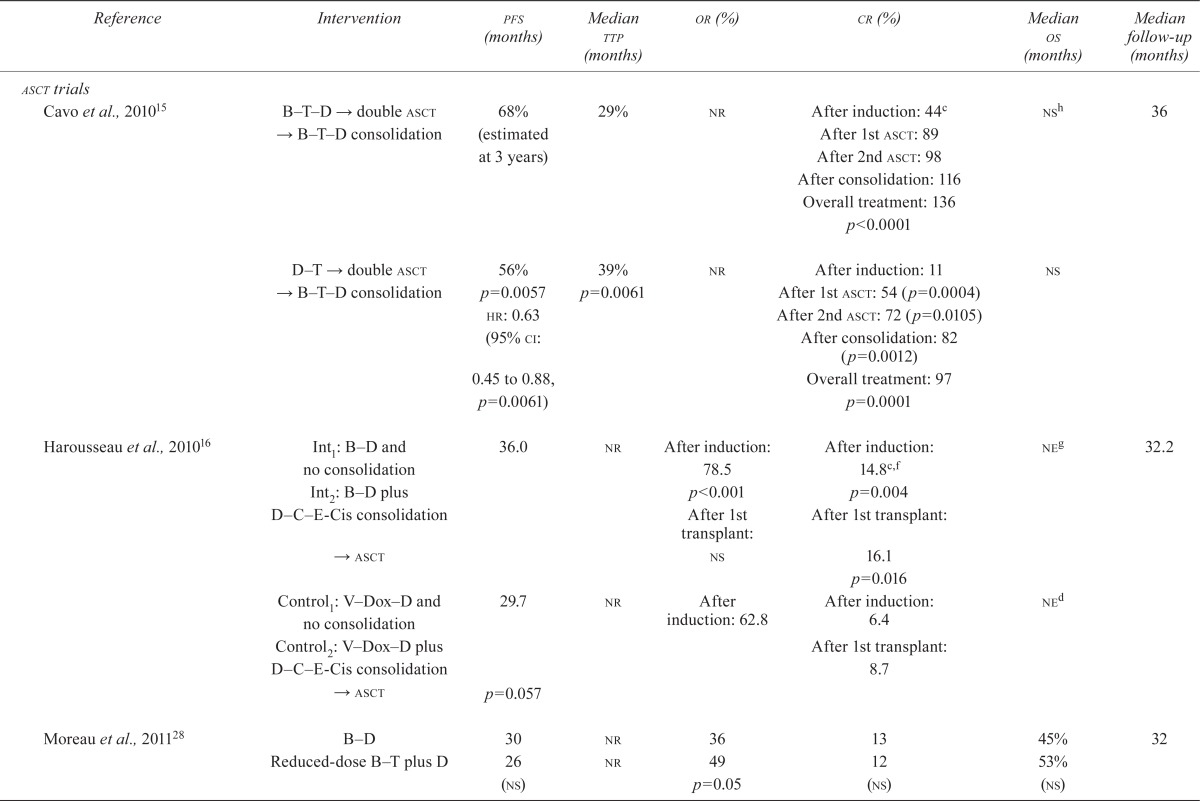
| asct trials | |||||||
| Cavo et al., 201015 | B T D → double asct → B T D consolidation | 68% (estimated at 3 years) | 29% | nr | After induction: 44c | nsh | 36 |
| After 1st asct: 89 | |||||||
| After 2nd asct: 98 | |||||||
| After consolidation: 116 | |||||||
| Overall treatment: 136 | |||||||
| p<0.0001 | |||||||
| D T → double asct → B T D consolidation | 56% | 39% | nr | After induction: 11 | ns | ||
| p=0.0057 | p=0.0061 | After 1st asct: 54 (p=0.0004) | |||||
| hr: 0.63 | After 2nd asct: 72 (p=0.0105) | ||||||
| (95% ci: 0.45 to 0.88, p=0.0061) | After consolidation: 82 | ||||||
| (p=0.0012) | |||||||
| Overall treatment: 97 | |||||||
| p=0.0001 | |||||||
| Harousseau et al., 201016 | Int1: B–D and no consolidation | 36.0 | nr | After induction: 78.5 | After induction: 14.8c,f | neg | 32.2 |
| Int2: B–D plus D–C–E-Cis consolidation | p<0.001 | p=0.004 | |||||
| → asct | After 1st transplant: ns | After 1st transplant: 16.1 | |||||
| p=0.016 | |||||||
| Control1: V–Dox–D and no consolidation | 29.7 | nr | After induction: 62.8 | After induction: 6.4 | ned | ||
| Control2: V–Dox–D plus D–C–E-Cis consolidation | After 1st transplant: 8.7 | ||||||
| → asct | p=0.057 | ||||||
| Moreau et al., 201128 | B–D | 30 | nr | 36 | 13 | 45% | 32 |
| Reduced-dose B–T plus D | 26 (ns) | nr | 49 p=0.05 | 12 (ns) | 53% (ns) | ||
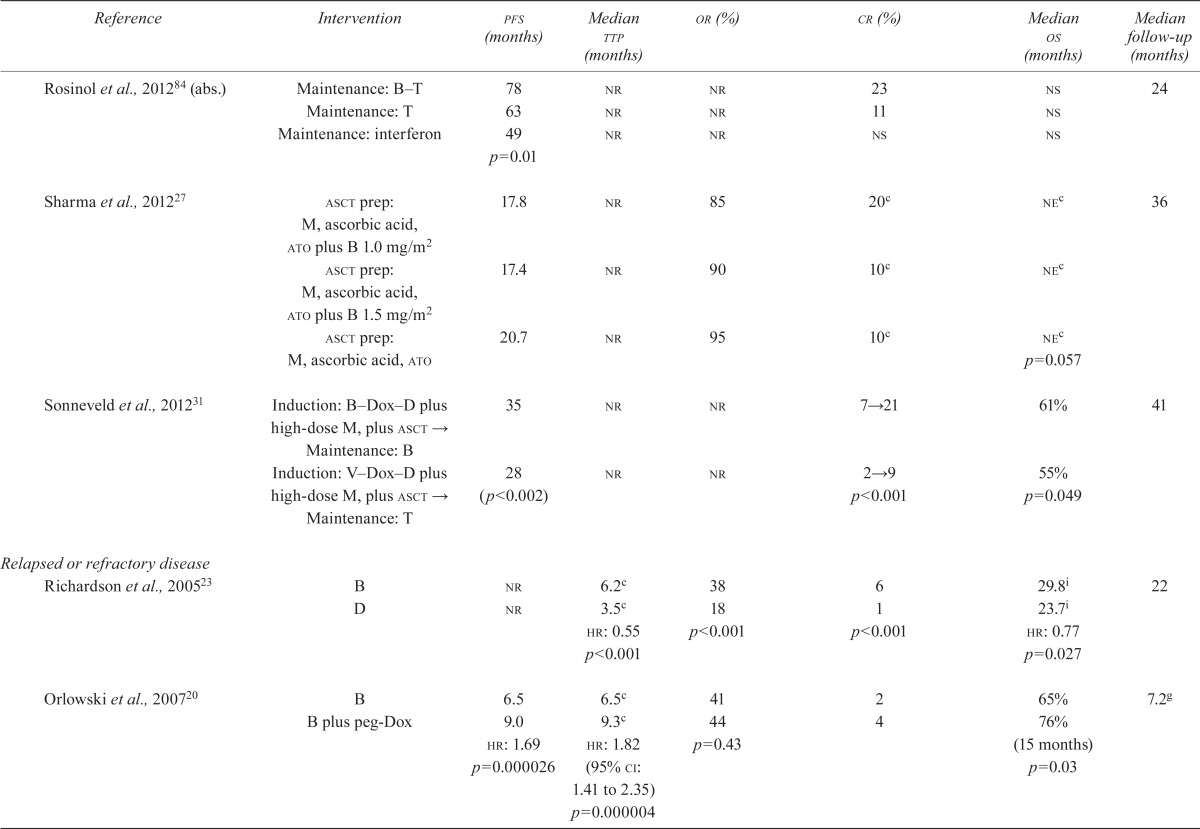
| Rosinol et al., 201284 (abs.) | Maintenance: B–T | 78 | nr | nr | 23 | ns | 24 |
| Maintenance: T | 63 | nr | nr | 11 | ns | ||
| Maintenance: interferon | 49 | nr | nr | ns | ns | ||
| p=0.01 | |||||||
| Sharma et al., 201227 | asct prep: M, ascorbic acid, ato plus B 1.0 mg/m2 | 17.8 | nr | 85 | 20c | nec | 36 |
| asct prep: M, ascorbic acid, ato plus B 1.5 mg/m2 | 17.4 | nr | 90 | 10c | nec | ||
| asct prep: M, ascorbic acid, ato | 20.7 | nr | 95 | 10c | nec | ||
| p=0.057 | |||||||
| Sonneveld et al., 201231 | Induction: B–Dox–D plus high-dose M, plus asct → | 35 | nr | nr | 7→21 | 61% | 41 |
| Maintenance: B Induction: V–Dox–D plus high-dose M, plus asct → | 28 | nr | nr | 2→9 | 55% | ||
| Maintenance: T | (p<0.002) | p<0.001 | p=0.049 | ||||
| Relapsed or refractory disease | |||||||
| Richardson et al., 200523 | B | nr | 6.2c | 38 | 6 | 29.8i | 22 |
| D | nr | 3.5c | 18 | 1 | 23.7i | ||
| hr: 0.55 | p<0.001 | p<0.001 | hr: 0.77 | ||||
| p<0.001 | p=0.027 | ||||||
| Orlowski et al., 200720 | B | 6.5 | 6.5c | 41 | 2 | 65% | 7.2g |
| B plus peg-Dox | 9.0 | 9.3c | 44 | 4 | 76% | ||
| hr: 1.69 | hr: 1.82 (95% ci: 1.41 to 2.35) | p=0.43 | (15 months) | ||||
| p=0.000026 | p=0.000004 | p=0.03 | |||||
| Lonial et al., 201017 | B (escalating doses of 1.0, 1.3, and 1.6 mg/m 2) 24 hours before M | ns | nr | 47 | 11 | ns | 17.3 |
| B (escalating doses of 1, 1.3, and 1.6 mg/m2) 24 hours after M | ns | nr | 55 | 30 | ns | ||
| Reece et al., 201122 | B 1.3 mg/m2 | nr | nr | 52 | 5 | nr | nr |
| B 1.0 mg/m2 | nr | nr | 48 | 10 | nr | ||
| Garderet et al., 201230 | B–T–D | 19.3 | 19.5 | 45 | 45 | 71% | 30 |
| T–D | 13.6 | 13.8 | 25 | 25 | 65% | ||
| p<0.001 | p<0.001 | p<0.001 | p<0.001 | (ns) | |||
| Hjorth et al., 201225 | B–D | 7.2 | 1.6 | 63 | nr | 19 | 3.5 on B, |
| T–D | 9 (ns) | 3.0 | 55 (ns) | nr | 22.8 | 5.1 on Tj | |
| p<0.005 | |||||||
| Orlowski et al., 201283 (abs.) | Siltuximab plus B | 8.1 | nr | 55 | 11 | 30.8 | 24.5 |
| B | 7.6 (ns) | nr | 47 (ns) | 7 (ns) | 36.9 (ns) | ||
Results in evaluable population (B–M–P: n = 337; M–P: n = 331).
Median follow-up was 36.7 months for overall survival and 16.3 months for time to progression in the original publication. An update55 confirmed a statistically significant survival benefit for B–M–P compared with M–P at a median follow-up of 25.9 months (hr: 0.64; p = 0.003). In a further publication59, 3-year rates of overall survival were estimated at 68.5% for B–M–P compared with 54% with M–P.
Results for primary outcome.
Bortezomib on a weekly schedule.
The original data cut-off was April 28, 2006, at which time the median follow-up was 7.2 months; survival and time to event data were reanalyzed with a data cut-off of November 28, 2006, upon request by the U.S. Food and Drug Administration. Median follow-up for overall survival and time to progression were not reported.
Results in the evaluable population (B–D: n = 223 after induction, n = 197 after first transplant; V–Dox–D: n = 218 after induction, n = 184 after first transplant).
Median overall has not been reached in either group. Overall survival rates were 81.4% with B–D and 81.4% with V–Dox–D.
The estimated 3-year overall survival was 86% compared with 84% (p = 0.30).
Data from an additional publication41.
Terminated early because of low accrual.
pfs = progression-free survival; ttp = time to progression; or = odds ratio; cr = complete response; os = overall survival; asct = autologous stem-cell transplantation; Int = intervention group; B = bortezomib; M = melphalan; P = prednisone; nr = not reported; hr = hazard ratio; ne = not reached or not estimable; T = thalidomide; ns = statistically nonsignificant; D = dexamethasone; C = cyclophosphamide; L = lenalidomide; abs. = abstract; E = etoposide; Cis = cisplatinum; V = vincristine; Dox = doxorubicin; ato = arsenic trioxide; peg-Dox = pegylated liposomal doxorubicin; ci = confidence interval.