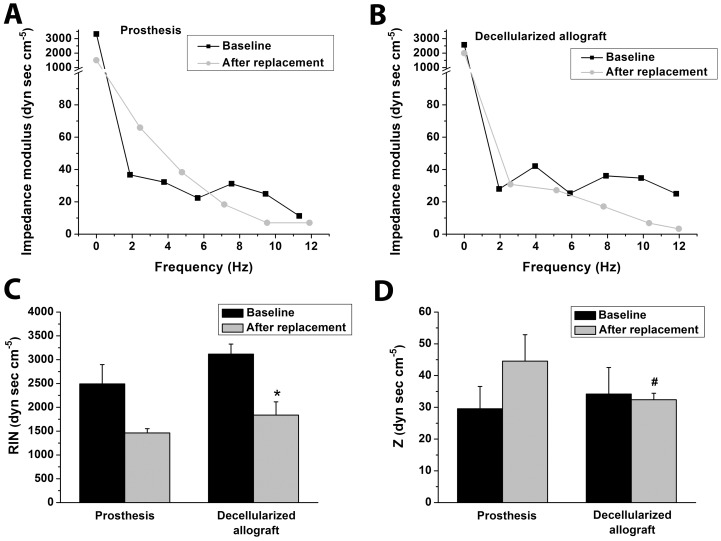
Figure 6. Vascular impedance spectrum.
Vascular impedance spectrum after total aortic arch replacement in a representative animal of the prosthesis (A) and decellularized allograft group (B). Input impedance (RIN, C), and characteristic impedance (Z, D) at baseline and after total aortic arch replacement in both groups. All values on panels C and D are given as means ± SEM, *:P<0.05 vs. Baseline, #:P<0.05 vs. Prosthesis

