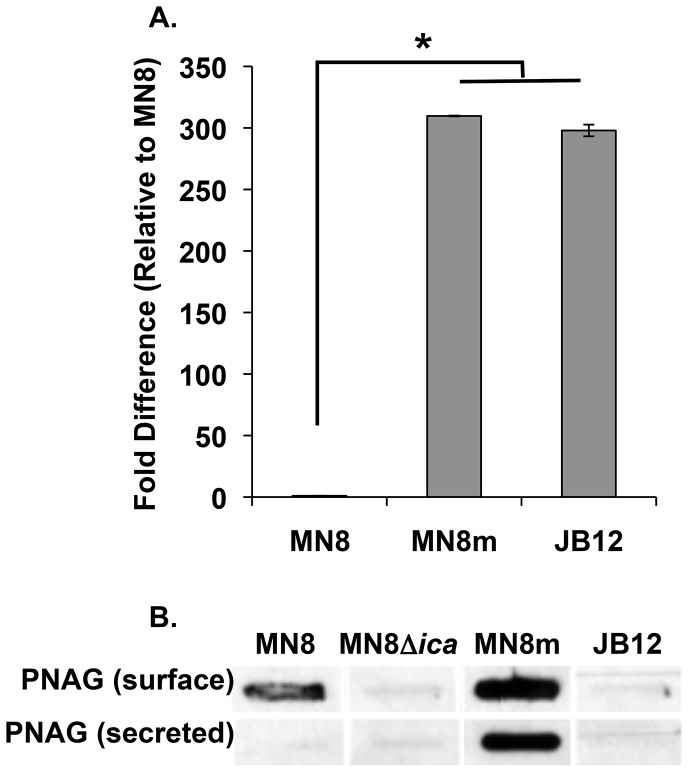
Figure 3. PIA/PNAG production in the non-mucoid variant.
A. Real-time RT-PCR analysis of icaC mRNA transcript was performed. Bars represent the mean fold difference in transcript amount relative to strain MN8 with n = 3, and error bars indicate the standard deviations. Statistical comparison (unpaired t test) of MN8m and JB12 versus MN8 gave a P value of <0.001. B. EDTA extractions of surface-associated PIA/PNAG, and spent medium from cultures (secreted polysaccharide) were blotted and probed with PNAG antiserum (MN8m extracts and spent medium were diluted 1∶100).

