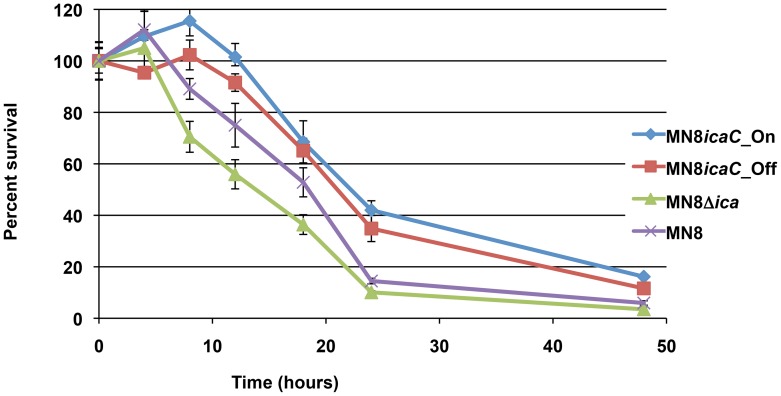
Figure 7. Survival in minimal media.
MN8m, JB12, and MN8Δica were grown in TSBG. The cells were collected and resuspended in minimal media lacking a carbon source to mimic starvation conditions. Points represent the mean percent value of cells enumerated at each time point relative to the starting populations with n = 3, and error bars indicate the standard deviations. Statistical comparison (unpaired t test) of MN8m versus JB12 and MN8Δica versus JB12 at 8 hours and 10 hours gave a P value of <0.0001. Comparison of MN8m versus JB12 and MN8Δica versus JB12 at 18 hours and 24 hours gave a P value of <0.001.

