
Figure 2.
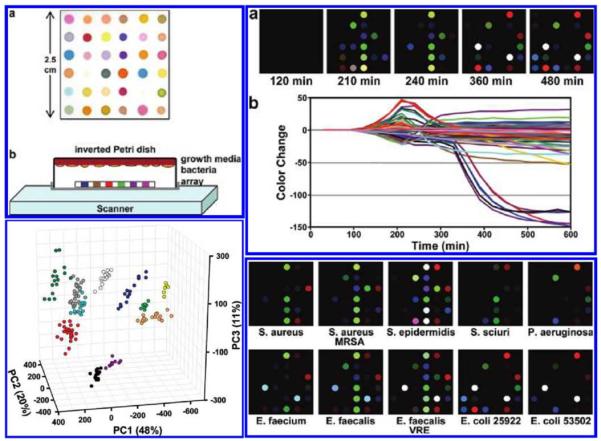
Flatbed scanner and a colorimetric sensor array used for the detection and identification of pathogenic bacteria grown on standard agar from the signatures created by the volatile organic compounds produced by the specimen. (Top Left) (a) The colorimetric sensor array and (b) the schematic of the apparatus containing an inverted Petri dish with the growth media, bacteria and the colorimetric sensor array placed on the scanner glass. (Top Right) (a) Color difference map of E. coli measurements captured over time from successive scans. (b) The color change plotted over time for each spot. (Bottom Right) The color difference maps for various bacterial strains. (Bottom Left) Principle component analysis (PCA) results for 10 strains of bacteria showing three principle components. Each color corresponds to a different strain. Reprinted (adapted) with permission from Reference 54. Copyright (2011) American Chemical Society.