
Figure 5.
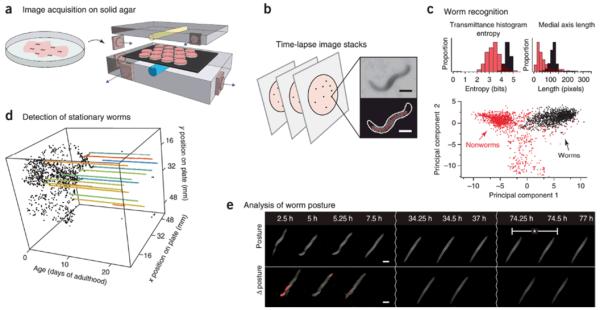
Images captured by several flatbed scanners inside an incubator for measurement of C. elegans lifespan. (a) Schematic showing Petri dishes containing age-synchronized C. elegans worms placed on the scanner. (b) Time-lapse images are captured by each scanner, and objects are segmented. Scale bars: 250μm. (c) Classification is done based on several morphological features; bar graphs show two examples. Bottom part shows a projection of the point cloud created by using 65 dimensional feature vectors to differentiate worms from non-worms. (d) The positions of the worms over time. Colored lines are stationary worms. (e) Graph of stationary animals over time, and their corresponding posture changes. The device can automatically gather death times from over 30,000 animals. Reprinted with permission from Macmillan Publishers Ltd: [Nature Methods] (Reference: 37), copyright (2013).